The Sales Performance Dashboard Excel Template for Retail Stores provides a comprehensive overview of key sales metrics, enabling managers to track daily, weekly, and monthly sales trends efficiently. It features customizable charts and tables that highlight top-selling products, revenue growth, and customer purchase behavior. Designed for ease of use, this template helps retail businesses make data-driven decisions to optimize sales strategies and improve overall performance.
Monthly Sales Performance Tracker Excel Template
The
Monthly Sales Performance Tracker Excel Template is a structured spreadsheet designed to monitor and analyze sales data across different time periods, products, and sales representatives. It enables businesses to identify trends, measure targets against actual sales, and make data-driven decisions to enhance revenue growth. By providing clear visualizations and organized data, this template simplifies performance evaluation and strategic planning.
Retail Store Sales Analysis Dashboard Template
The
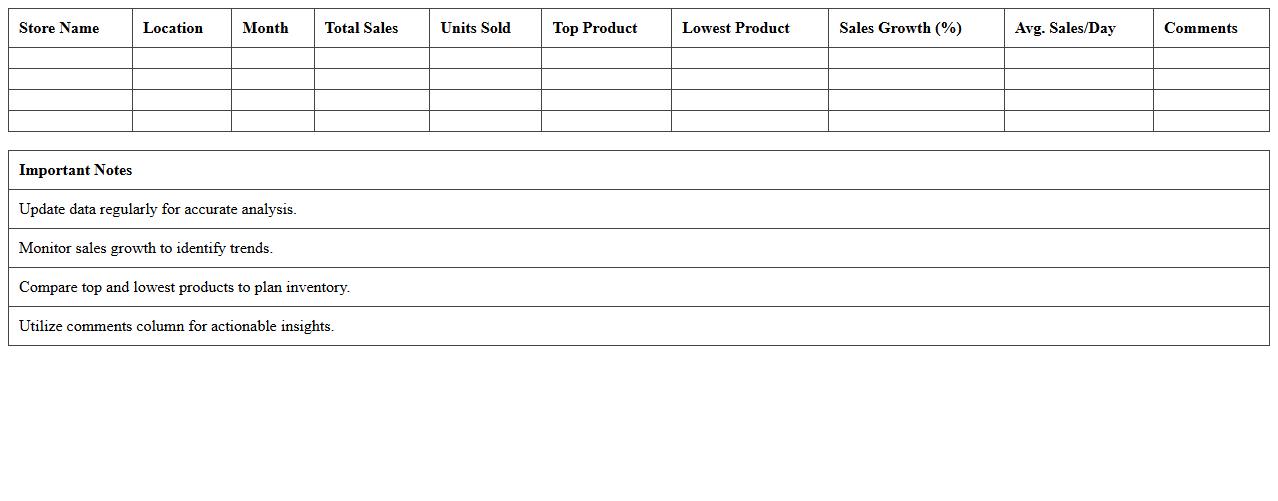
Retail Store Sales Analysis Dashboard Template document provides a comprehensive framework to track, visualize, and analyze sales data from retail stores efficiently. It helps businesses identify sales trends, monitor product performance, and optimize inventory management by consolidating key metrics such as revenue, units sold, and customer demographics. Utilizing this dashboard enables data-driven decision-making that enhances profitability and operational efficiency in retail environments.
Sales Revenue Comparison Excel Sheet
A
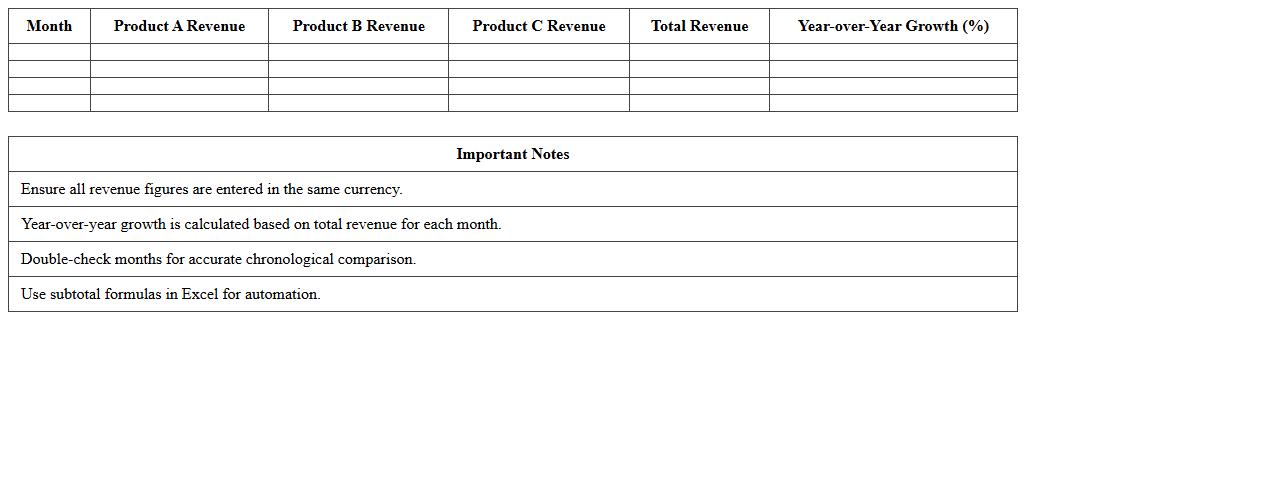
Sales Revenue Comparison Excel Sheet document is a spreadsheet designed to track and compare sales revenue across different time periods, products, or regions. It helps businesses identify trends, measure performance, and make data-driven decisions by visualizing growth or decline in sales figures. This tool is essential for budget planning, forecasting, and optimizing sales strategies to increase profitability.
Product-wise Sales Performance Excel Tracker
The
Product-wise Sales Performance Excel Tracker document is a detailed spreadsheet designed to monitor and analyze sales data for individual products across various time periods and regions. It enables businesses to identify trends, measure product profitability, and make data-driven decisions to optimize inventory and marketing strategies. By providing clear visualizations of sales metrics, the tracker supports improved forecasting and strategic planning for maximizing revenue.
Store Location Sales Metrics Dashboard Excel
The
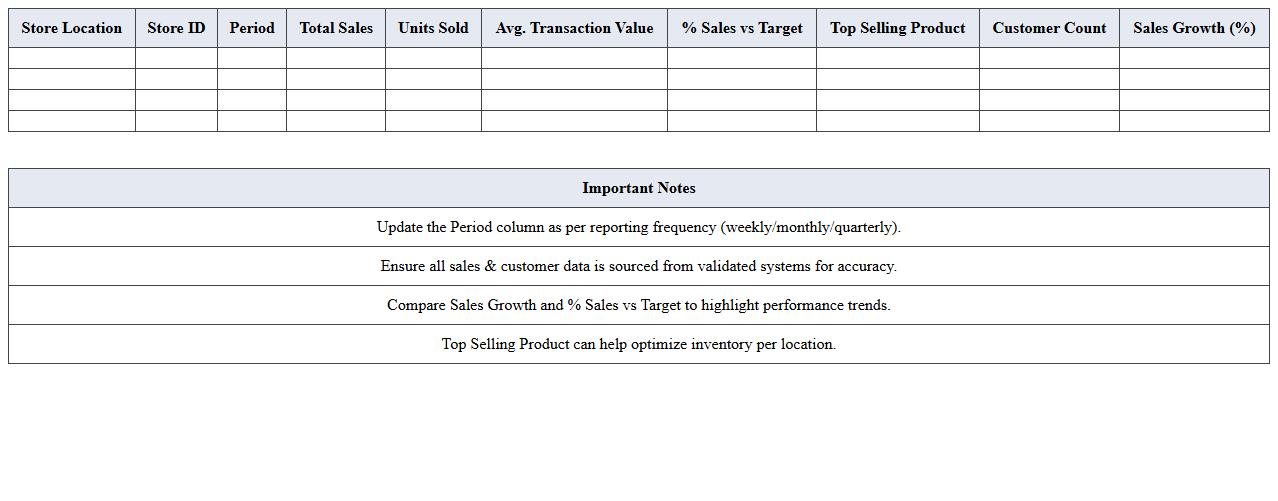
Store Location Sales Metrics Dashboard Excel document consolidates key sales data across multiple store locations into an interactive, easy-to-analyze format. It enables businesses to track performance indicators such as revenue, transaction volume, and average sales per store, facilitating data-driven decisions to optimize operations. This dashboard helps identify top-performing locations and areas needing improvement, ultimately enhancing overall sales strategies and resource allocation.
Sales Target Achievement Excel Template
The
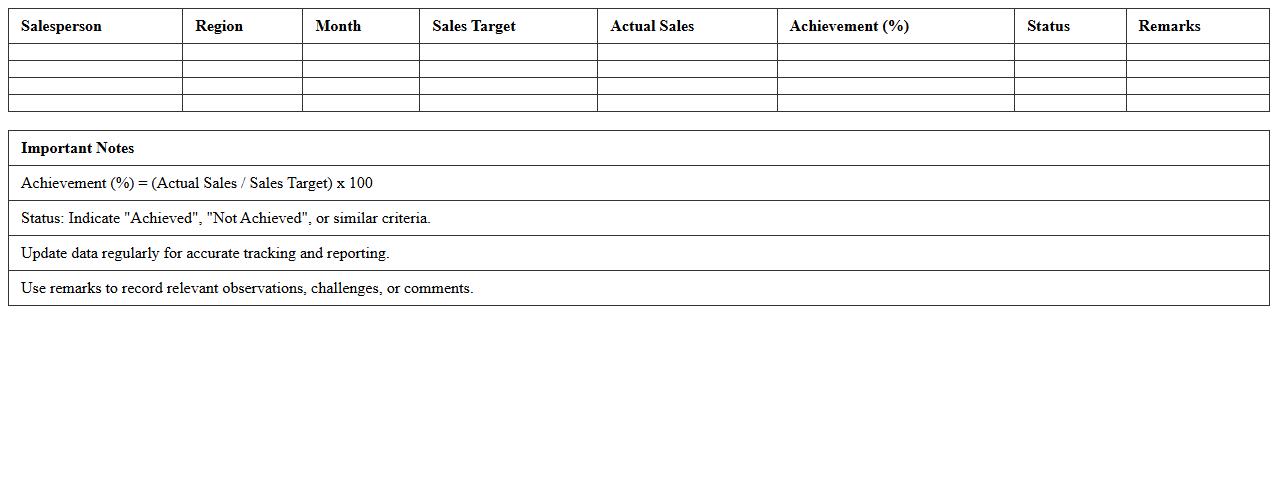
Sales Target Achievement Excel Template is a powerful tool designed to track and analyze sales performance against predefined goals. This document enables sales teams and managers to monitor progress, identify gaps, and make data-driven decisions to enhance productivity. By providing clear visualizations and organized data entry fields, it streamlines the process of evaluating sales achievements and planning future strategies.
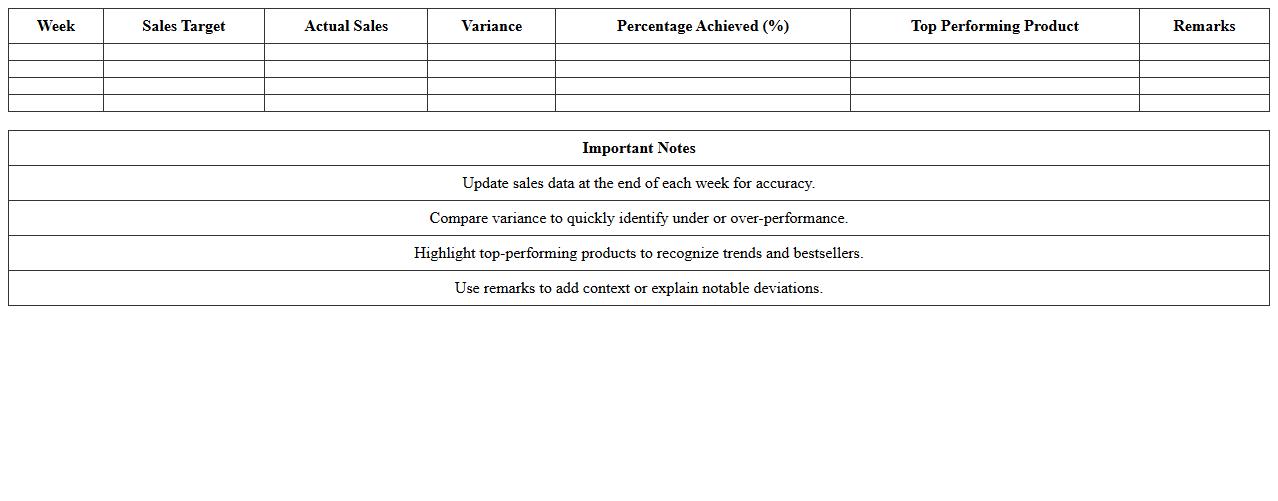
Weekly Sales Performance Monitoring Excel
The
Weekly Sales Performance Monitoring Excel document is a powerful tool designed to track and analyze sales data on a weekly basis, helping businesses identify trends, measure individual and team performance, and forecast future sales accurately. It enables sales managers to monitor key performance indicators (KPIs) such as total sales, conversion rates, and customer acquisition costs in a structured and visually intuitive format. By providing real-time insights, this document supports data-driven decision-making and promotes timely adjustments to sales strategies.
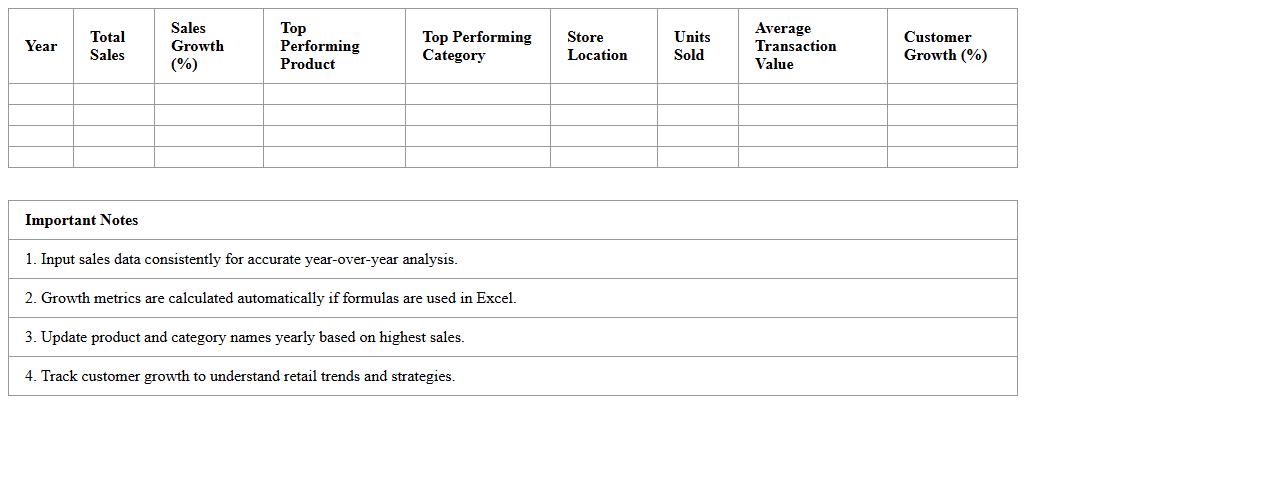
Yearly Retail Sales Growth Dashboard Template
The
Yearly Retail Sales Growth Dashboard Template is a powerful tool designed to visually track and analyze retail sales performance over time. It consolidates key sales metrics, trends, and growth rates into an easy-to-understand format, enabling businesses to make informed decisions for strategy optimization. This template enhances forecasting accuracy, identifies sales opportunities, and supports proactive management of retail operations for sustained growth.
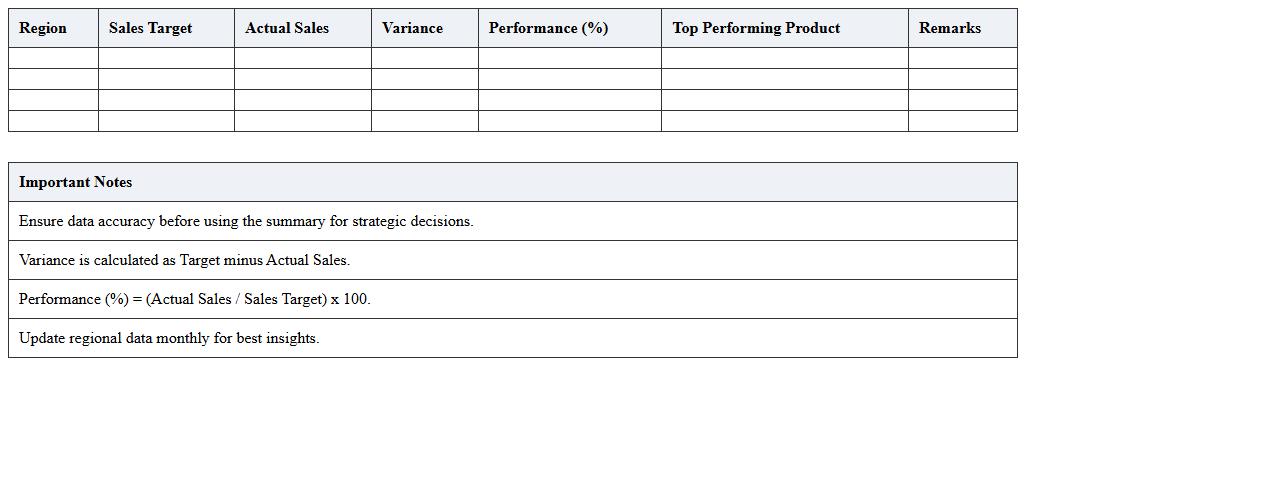
Regional Sales Performance Summary Excel
The
Regional Sales Performance Summary Excel document provides a detailed overview of sales metrics across different geographic areas, enabling businesses to track revenue, growth rates, and product performance regionally. By consolidating data into visually accessible charts and tables, it helps identify trends, strengths, and weaknesses in sales strategies. This tool supports informed decision-making by highlighting high-performing regions and areas requiring improvement, optimizing resource allocation and sales efforts.
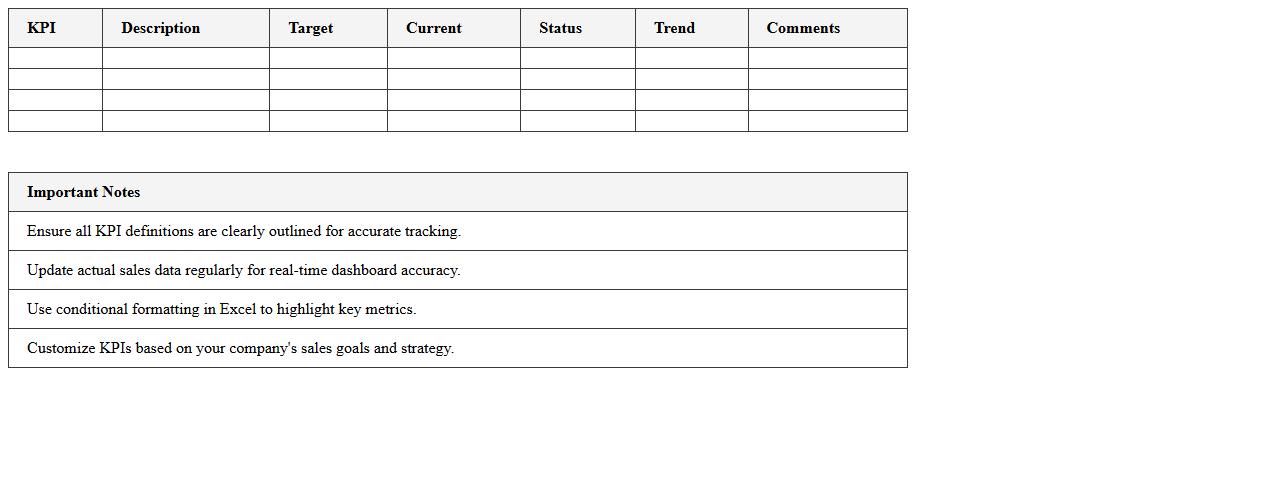
Sales Performance KPI Dashboard Excel Template
A
Sales Performance KPI Dashboard Excel Template document is a powerful tool designed to track, visualize, and analyze key sales metrics such as revenue, conversion rates, and sales targets in real-time. It allows businesses to monitor sales team productivity, identify trends, and make data-driven decisions to improve overall sales effectiveness. By consolidating complex data into a clear, interactive format, this dashboard enhances performance management and strategic planning for sales departments.
How can I customize sales KPI metrics in the dashboard for individual retail locations?
To customize sales KPI metrics for individual retail locations, start by selecting the location-specific data sources in your dashboard settings. Use filters and segmentation features to isolate performance metrics such as sales volume, average transaction size, and customer footfall by location. This ensures that each retail outlet's unique data is accurately represented for targeted analysis.
What filters are available for tracking product category performance over time?
Available filters for tracking product category performance typically include date ranges, category types, and sales channels. These filters allow users to view trends, compare seasonal results, and analyze category-specific sales behaviors across multiple periods. Applying these filters helps in identifying which categories are driving growth or need improvement over time.
Can the dashboard visualize sales trends segmented by in-store promotions?
The dashboard can effectively visualize sales trends segmented by in-store promotions by integrating promotion data with sales records. Users can create custom graphs and reports that distinguish sales performance during promotional periods versus regular days. This segmentation provides insights into the impact of different promotional strategies on store revenue.
How do I automate data updates from multiple store Excel files into one dashboard?
Automate data updates by connecting the dashboard to a centralized data repository where all Excel files from stores are uploaded. Use tools such as ETL processes or spreadsheet automation software to consolidate and refresh data seamlessly. This process ensures that the dashboard reflects the most current sales information without manual input.
Which formulas best track employee sales contributions within the dashboard?
Formulas like SUMIFS, COUNTIFS, and VLOOKUP are essential for tracking employee sales contributions accurately in the dashboard. These formulas help aggregate sales data by employee, calculate totals, and cross-reference with performance targets. Implementing these calculations provides clear visibility into individual team members' sales effectiveness.
More Dashboard Excel Templates