The Real Estate Portfolio Dashboard Excel Template for Investors offers a comprehensive tool to track and analyze property investments efficiently. It features customizable charts and detailed financial metrics that help investors monitor cash flow, ROI, and property performance in one centralized location. This template streamlines portfolio management, enabling data-driven decisions to maximize real estate investment success.
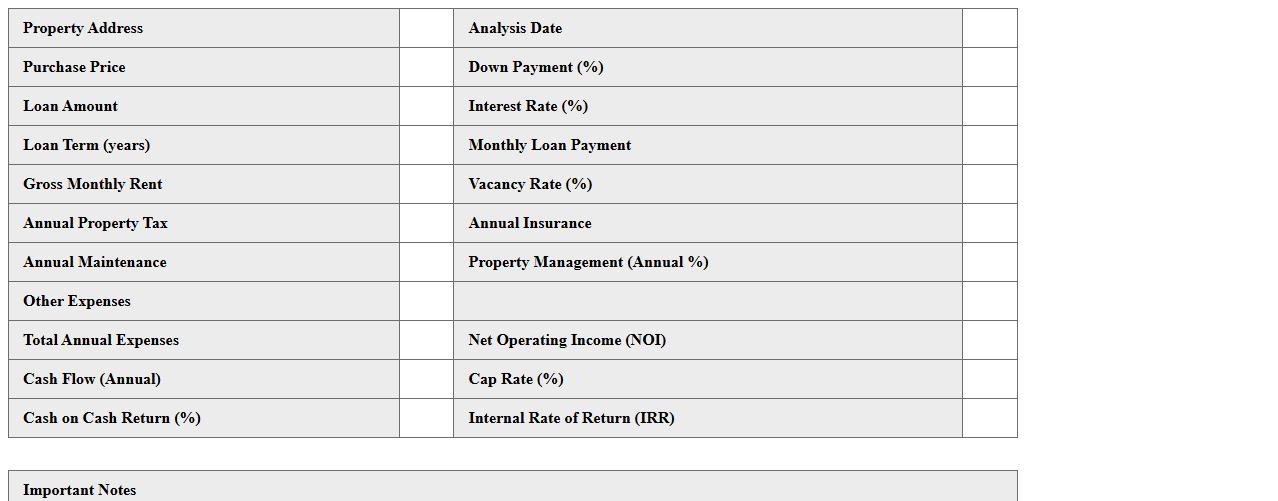
Real Estate Investment Property Analysis Excel Template
The
Real Estate Investment Property Analysis Excel Template document is a powerful tool designed to evaluate the financial performance and potential returns of real estate investments. It allows investors to input data such as purchase price, rental income, expenses, and financing terms to generate detailed reports on cash flow, ROI, and net present value. This template streamlines decision-making by providing clear, data-driven insights that help assess property viability and optimize investment strategies.
Rental Income and Expense Tracker Spreadsheet
A
Rental Income and Expense Tracker Spreadsheet is a digital tool designed to systematically record and monitor rental property earnings and associated costs. It helps landlords and property managers maintain organized financial records, making it easier to analyze profitability, prepare tax documents, and identify areas for cost reduction. This spreadsheet enhances financial planning by providing clear insights into cash flow, ensuring informed decision-making for property investments.
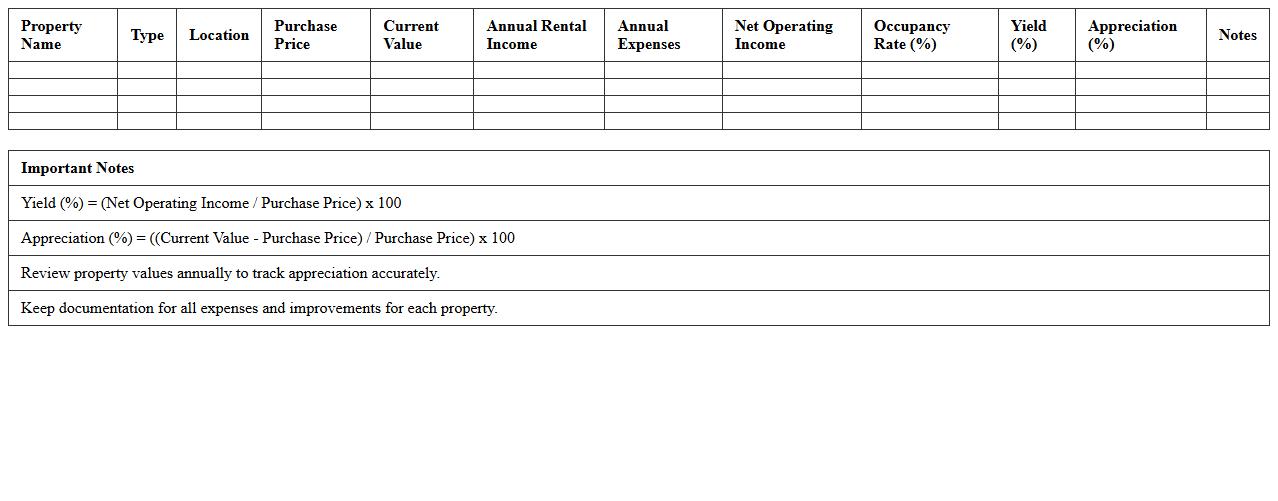
Real Estate Portfolio Performance Summary Excel
A
Real Estate Portfolio Performance Summary Excel document consolidates critical financial metrics such as return on investment, cash flow, and occupancy rates for multiple properties in one place. It enables investors and property managers to track asset performance, identify trends, and make data-driven decisions to maximize profitability. This tool streamlines complex data analysis, improving portfolio management efficiency and strategic planning.
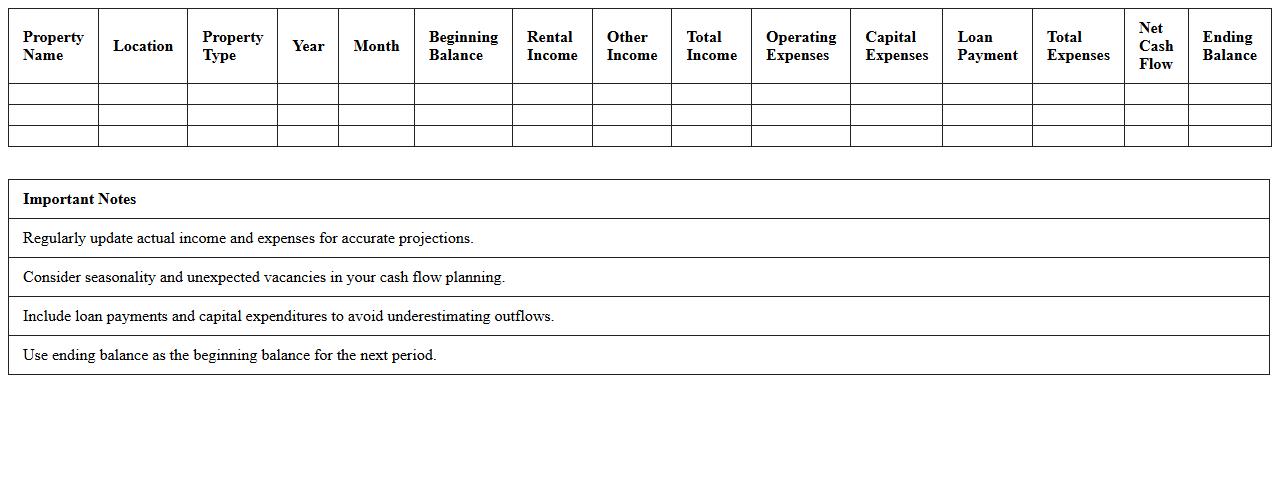
Cash Flow Projection for Real Estate Portfolio Excel
A
Cash Flow Projection for Real Estate Portfolio Excel document is a financial tool designed to estimate and track future income and expenses across multiple properties, helping investors forecast net cash flow over time. It consolidates rent collections, operating costs, loan payments, and capital expenditures into a detailed, customizable spreadsheet that supports dynamic scenario analysis and budget planning. This projection enhances decision-making by providing clear visibility into potential profitability, liquidity needs, and investment performance across the entire real estate portfolio.
Real Estate Asset Valuation Tracker Excel Template
The
Real Estate Asset Valuation Tracker Excel Template is a comprehensive tool designed to help investors and property managers accurately assess the market value of real estate assets over time. It enables users to input key property details, track valuation changes, and analyze trends through customizable charts and formulas. This template streamlines decision-making by providing clear insights into portfolio performance, enhancing investment strategies and financial planning.
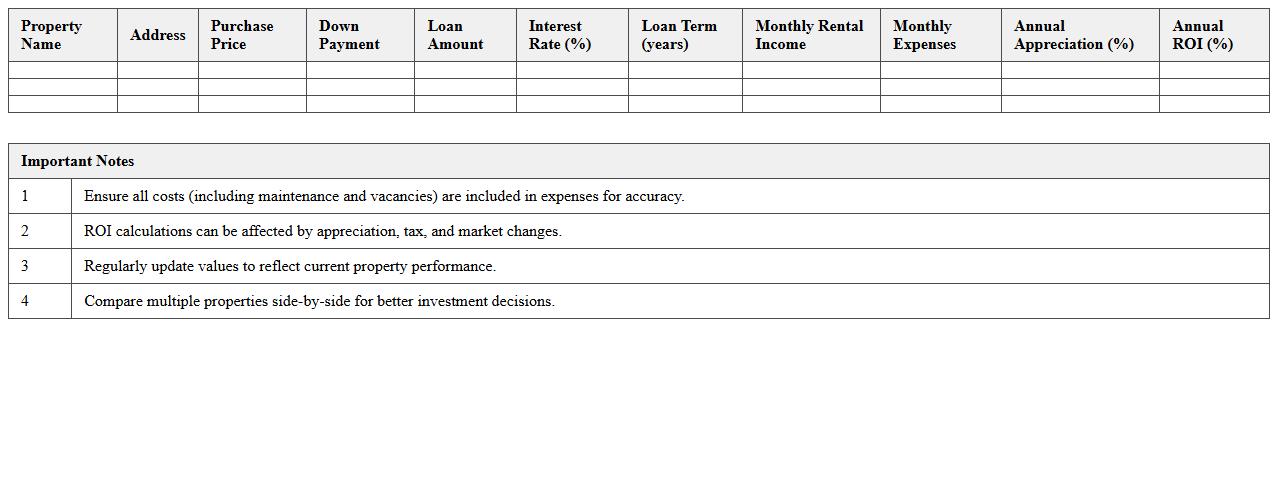
Multi-Property ROI Calculator Spreadsheet
A
Multi-Property ROI Calculator Spreadsheet is a tool designed to analyze the return on investment across several real estate properties simultaneously. It helps investors compare cash flow, expenses, and profitability to make informed decisions on property acquisitions or management strategies. By consolidating financial data, the spreadsheet streamlines investment evaluation and enhances portfolio growth planning.
Property Acquisition Pipeline Tracker Excel
The
Property Acquisition Pipeline Tracker Excel document is a comprehensive tool designed to monitor and manage potential real estate investments from initial lead generation to final acquisition. It enables users to track deal progress, key contact information, financial metrics, and important deadlines in one centralized location, enhancing organization and decision-making. This tracker improves efficiency by providing clear visibility into acquisition stages and streamlining workflow for real estate professionals and investors.
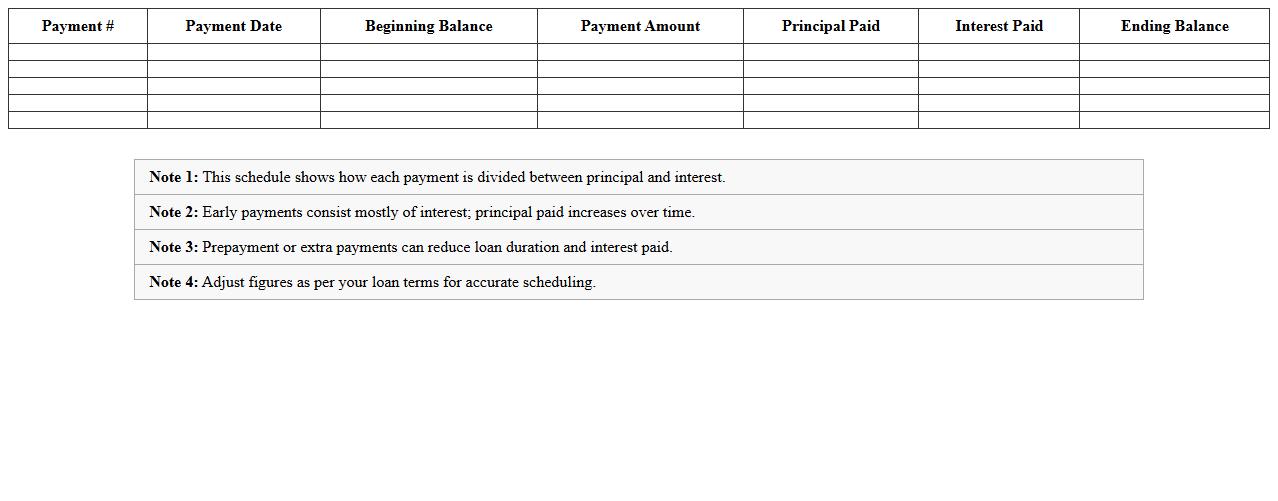
Mortgage Amortization and Loan Schedule Template
A
Mortgage Amortization and Loan Schedule Template is a structured document that breaks down each loan payment into principal and interest components over the loan term. This template helps borrowers visualize the gradual reduction of loan balance and track payment dates, ensuring better financial planning. It also assists in forecasting total interest paid and identifying opportunities for early repayment to save money.
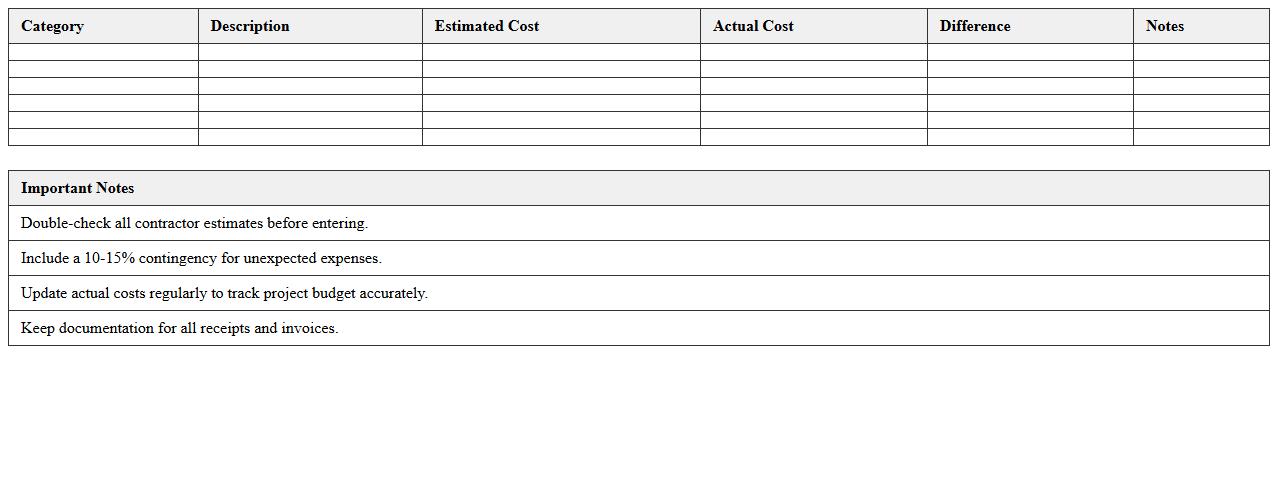
Real Estate Renovation Budget Excel Sheet
A
Real Estate Renovation Budget Excel Sheet is a detailed spreadsheet designed to track and manage all financial aspects of property renovations, including material costs, labor fees, and contingency funds. It allows users to maintain precise control over expenses, forecast potential overruns, and compare budgeted versus actual spending to ensure project profitability. Utilizing this tool streamlines decision-making in real estate investments by providing transparent and organized financial data throughout the renovation process.
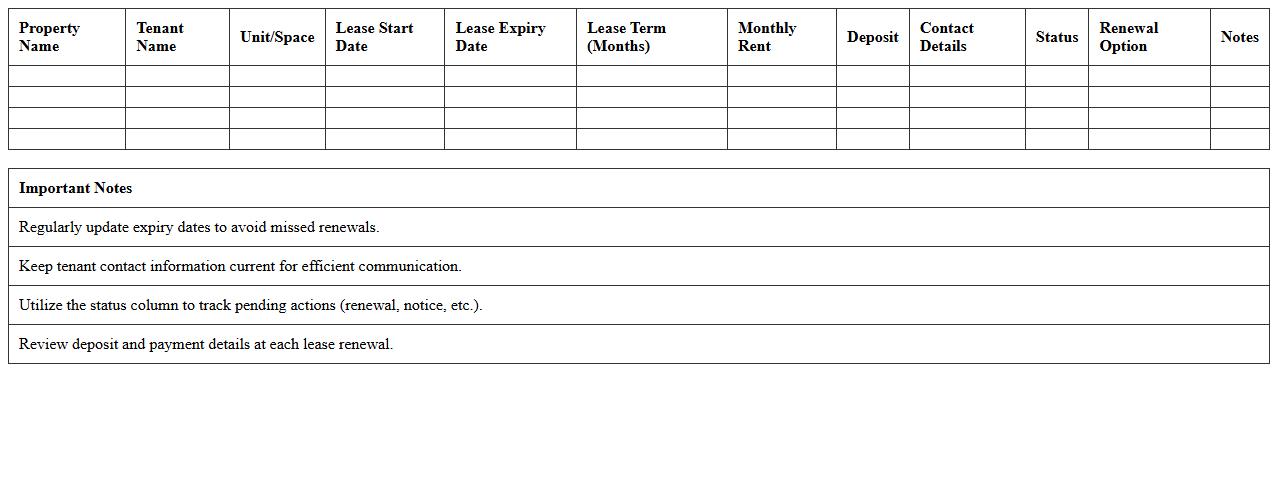
Lease Expiry and Tenant Management Dashboard Excel
The
Lease Expiry and Tenant Management Dashboard Excel is a comprehensive tool designed to track lease agreements, monitor upcoming expirations, and manage tenant information efficiently. It provides real-time insights into lease timelines, rent schedules, and tenant contact details, enabling proactive decision-making and reducing the risk of lease lapses. This dashboard streamlines property management tasks, enhances communication, and supports effective financial planning by centralizing all relevant data in an easy-to-use format.
How does the dashboard visualize individual property performance over time?
The dashboard uses interactive charts and graphs to display property performance trends. Users can track key metrics such as cash flow, net operating income, and occupancy rates over various time periods. This visualization enables quick identification of performance patterns and anomalies for each property.
Can the Excel template track and compare rental yields across multiple regions?
The Excel template includes features to input and aggregate rental data from different locations, supporting multi-regional analysis. It uses formulas and pivot tables to calculate rental yields by region, facilitating easy comparisons. Users can customize reports to highlight the best performing regions in their portfolio.
Is there an automated feature for consolidating monthly expense reports per asset?
Yes, the system offers an automated consolidation tool that aggregates expense data for each asset monthly. It imports data from various sources and categorizes expenses to streamline tracking. This automation reduces manual errors and saves time for portfolio managers.
How customizable are the KPIs for different real estate investment strategies?
The dashboard allows users to fully customize KPIs to align with diverse investment strategies like buy-and-hold, flipping, or commercial leasing. Users can select, add, or modify KPIs to measure factors such as cash-on-cash return, IRR, or vacancy rates. This flexibility ensures relevant insights tailored to specific investment goals.
Does the dashboard support scenario analysis for refinancing or portfolio sale events?
The platform provides scenario analysis tools that simulate impacts of refinancing or portfolio sales on overall returns. Users can adjust variables such as loan terms, sale prices, and holding periods to forecast outcomes. This feature enhances strategic decision-making by modeling potential financial scenarios.
More Dashboard Excel Templates