The Lead Generation Dashboard Excel Template for B2B Companies offers a streamlined way to track and analyze lead data, enhancing decision-making and sales strategies. This template includes customizable charts and metrics designed specifically to monitor lead sources, conversion rates, and sales pipeline progress. It empowers B2B companies to optimize marketing campaigns and improve overall lead management efficiency.
B2B Lead Source Tracking Excel Dashboard
A
B2B Lead Source Tracking Excel Dashboard document systematically organizes and visualizes data on the origins of business-to-business leads, enabling precise identification of the most effective marketing channels. It provides insights into lead generation patterns, helping sales and marketing teams allocate resources efficiently and improve conversion rates. This tool enhances decision-making by tracking lead performance metrics, campaign ROI, and lead quality in a single, easy-to-navigate interface.
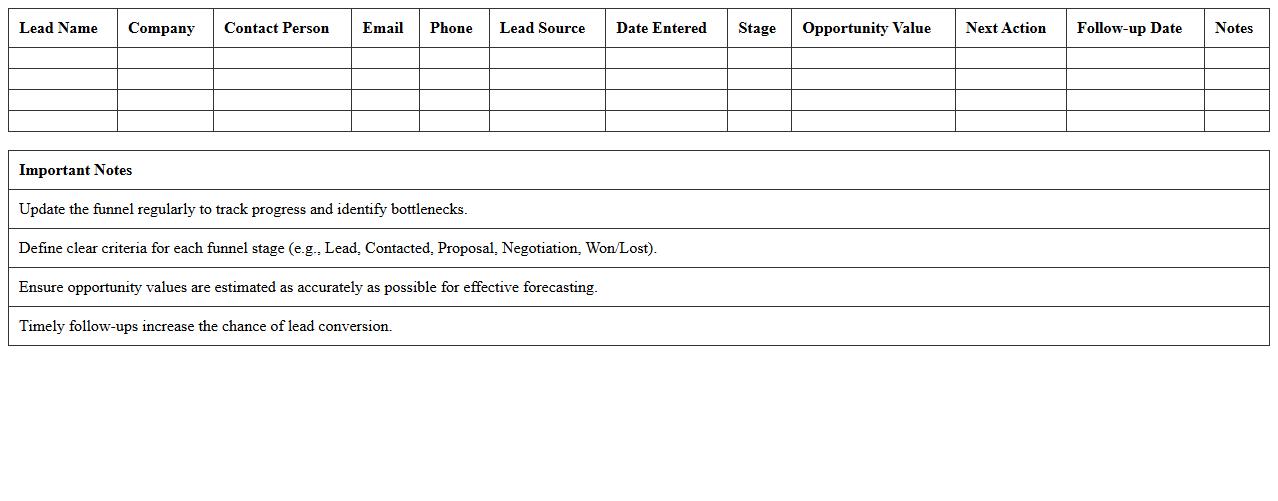
Sales Funnel Management Template for B2B Leads
A
Sales Funnel Management Template for B2B leads is a structured document that tracks and organizes potential clients through each stage of the sales process, from initial contact to closing. This template enables businesses to visualize lead progression, identify bottlenecks, and prioritize high-value opportunities effectively. By streamlining lead management, it maximizes conversion rates and enhances overall sales team productivity.
B2B Leads Qualification Tracker Excel
A
B2B Leads Qualification Tracker Excel document is a structured tool designed to organize and evaluate potential business clients based on specific qualification criteria such as budget, authority, need, and timeline. It helps sales and marketing teams prioritize high-quality leads, ensuring efficient resource allocation and increasing conversion rates. By providing a clear overview of lead status and interactions, this tracker enhances decision-making and streamlines the sales pipeline management.
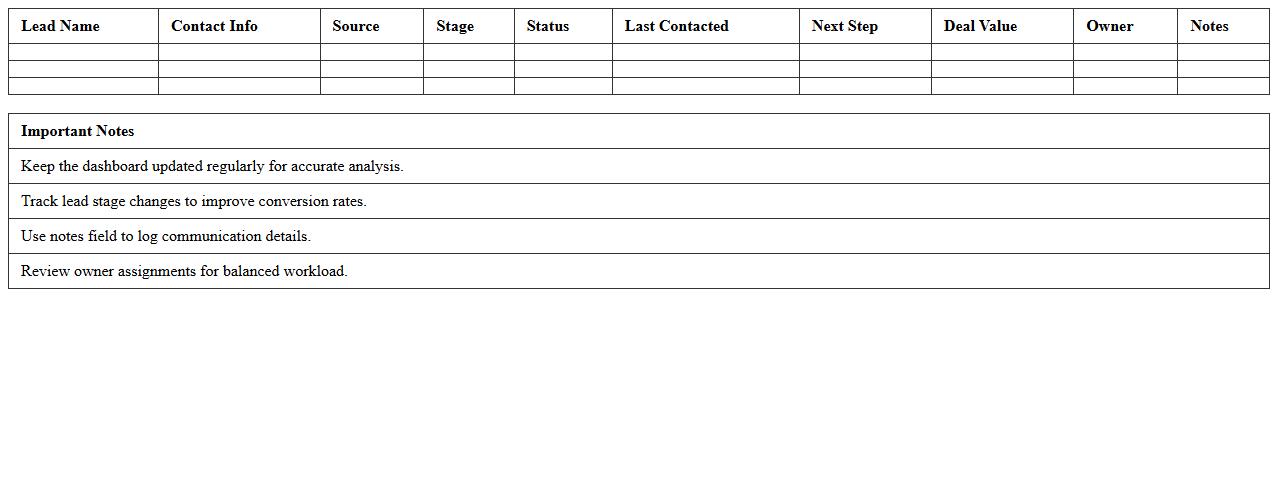
Lead Nurturing Pipeline Dashboard Template
The
Lead Nurturing Pipeline Dashboard Template is a strategic tool designed to visualize and manage the progression of leads through different stages of the sales funnel. This document tracks interactions, engagement metrics, and conversion probabilities, enabling sales teams to prioritize efforts and optimize communication for higher conversion rates. By providing clear insights into lead status and pipeline health, it supports data-driven decision-making and enhances overall sales effectiveness.
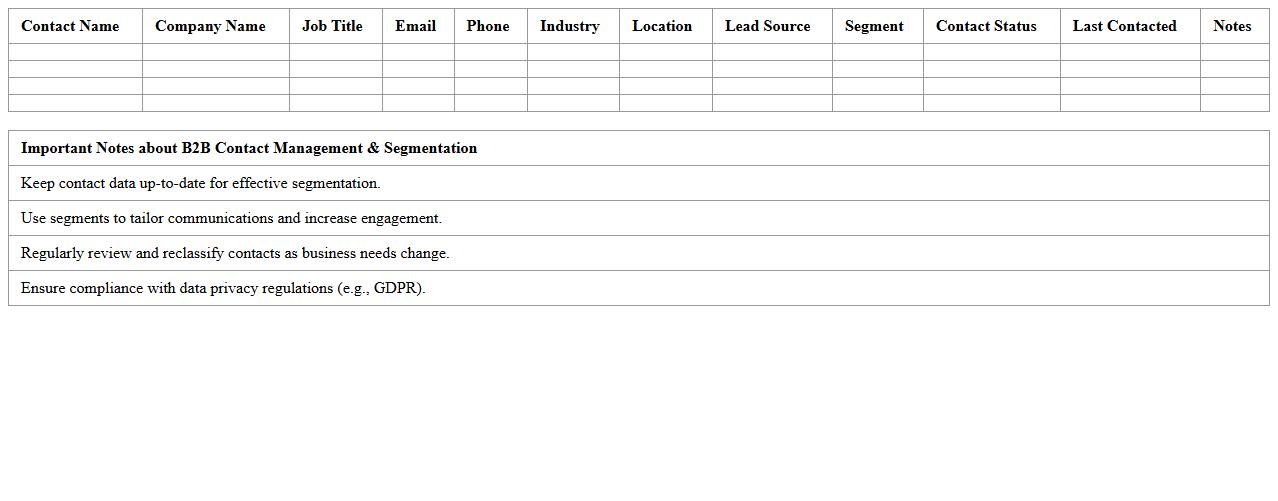
B2B Contact Management & Segmentation Excel
A
B2B Contact Management & Segmentation Excel document organizes and categorizes business contacts based on specific criteria such as industry, company size, and purchasing behavior. This tool enhances targeted marketing efforts, streamlines communication strategies, and improves sales pipeline management. Efficient segmentation within the Excel file allows businesses to personalize outreach, increase conversion rates, and optimize resource allocation.
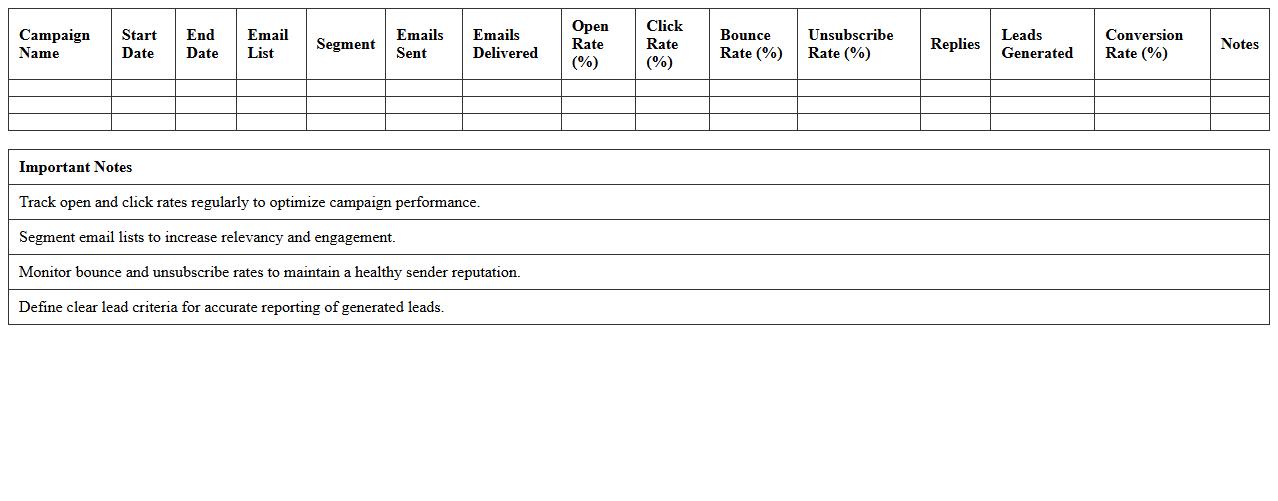
Email Campaign Monitoring Template for Lead Generation
The
Email Campaign Monitoring Template for Lead Generation is a structured document designed to track and analyze the performance of email marketing efforts targeted at acquiring new leads. It helps businesses measure key metrics such as open rates, click-through rates, conversion rates, and subscriber engagement, enabling data-driven decisions to optimize future campaigns. By using this template, teams can identify successful strategies, detect issues in real-time, and enhance lead nurturing processes to maximize ROI.
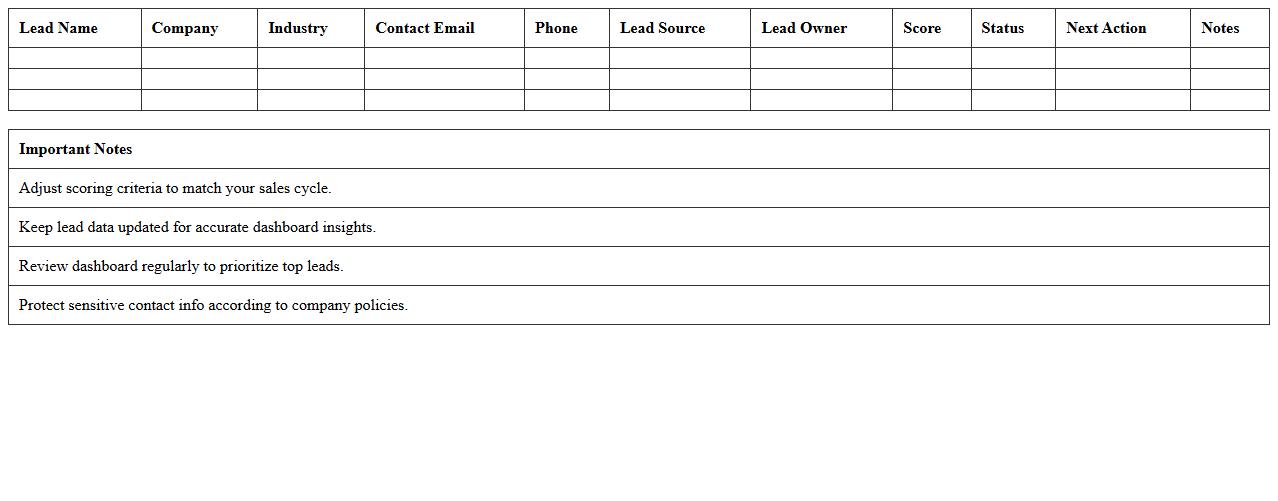
B2B Lead Scorecard Excel Dashboard
The
B2B Lead Scorecard Excel Dashboard is a comprehensive tool designed to evaluate and prioritize business-to-business leads based on customizable scoring criteria such as engagement level, demographic fit, and buying intent. This dashboard consolidates data into visual charts and tables, enabling sales and marketing teams to identify high-potential prospects efficiently and allocate resources strategically. By leveraging this document, organizations improve lead qualification accuracy, streamline follow-up processes, and enhance conversion rates through data-driven decision-making.
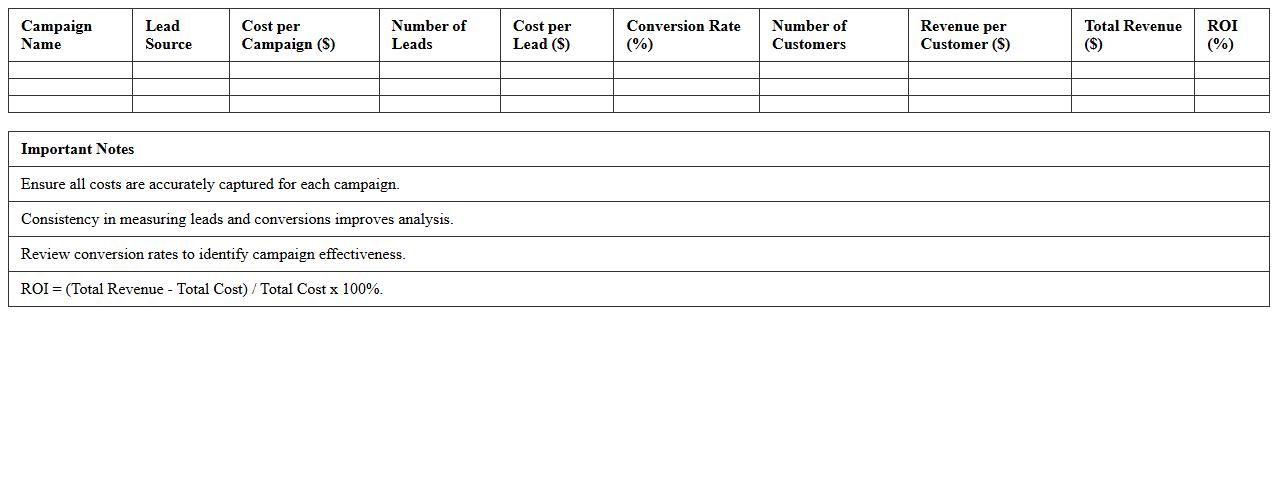
Lead Generation ROI Analysis Template
A
Lead Generation ROI Analysis Template document helps businesses measure the return on investment from their lead generation efforts by tracking costs, leads acquired, and revenue generated. It enables marketing teams to identify the most effective campaigns and allocation of budget to maximize profitability. Using this template streamlines decision-making by providing clear insights into which strategies deliver the highest financial returns.
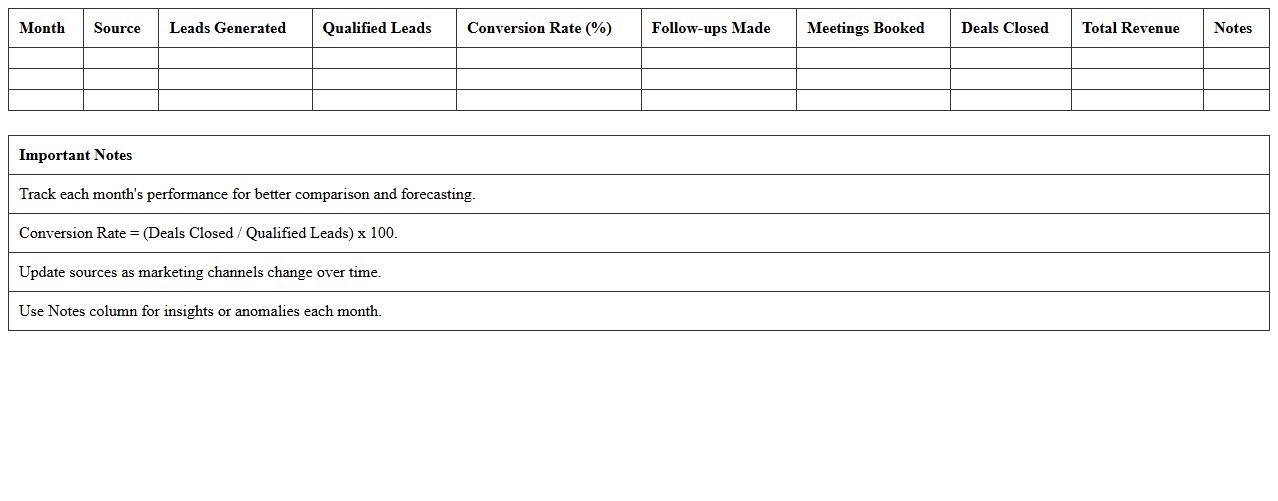
Monthly B2B Lead Performance Excel Report
The
Monthly B2B Lead Performance Excel Report document tracks and analyzes the effectiveness of lead generation efforts across various channels, providing detailed metrics such as conversion rates, lead sources, and sales pipeline status. It helps sales and marketing teams identify trends, optimize strategies, and allocate resources more efficiently to improve lead quality and increase revenue. This report serves as a vital tool for data-driven decision-making and measuring return on investment in B2B lead generation initiatives.
Lead Conversion Rate Tracking Excel Dashboard
A
Lead Conversion Rate Tracking Excel Dashboard is a dynamic tool designed to monitor and analyze the percentage of leads that turn into paying customers. It consolidates key metrics such as total leads, conversions, and conversion rates into visual charts and tables for easy interpretation. This dashboard helps businesses identify trends, optimize marketing strategies, and improve sales performance by providing actionable insights.
What key KPIs should be tracked in a B2B Lead Generation Dashboard Excel template?
Tracking Lead Conversion Rate is essential to measure the efficiency of your lead generation efforts. Monitoring Cost Per Lead (CPL) helps in understanding the financial impact of your campaigns. Additionally, Lead Source Performance allows you to identify the most productive channels driving qualified leads.
How can you automate lead scoring formulas within Excel dashboards for B2B leads?
Use Excel's IF and VLOOKUP functions to assign dynamic scores based on lead attributes like industry and engagement level. Incorporate weighted formulas to prioritize criteria such as company size and job title automatically. These automated formulas enable real-time updating of lead scores without manual intervention.
Which Excel data visualization tools best display B2B lead sources and conversion rates?
Pivot Tables summarize and analyze lead data efficiently, allowing quick insights into lead sources. Clustered Bar Charts are ideal to compare conversion rates across multiple channels visually. Implementing Slicers enhances interactivity, enabling filtering by time periods or lead segments.
How to segment leads by company size or industry within an Excel lead generation dashboard?
Create custom Data Validation drop-down lists to categorize leads by company size and industry. Utilize Pivot Tables grouped by these categories for efficient segmentation and detailed analysis. Conditional formatting highlights key segments, improving dashboard readability and decision-making.
What Excel integrations optimize real-time B2B lead data imports for dashboard accuracy?
Integrate Excel with Microsoft Power Query to automate and streamline real-time data imports from CRM systems. Connectors for platforms like Salesforce and HubSpot ensure lead data is always up-to-date. These integrations eliminate manual data entry, enhancing the accuracy and reliability of your dashboards.
More Dashboard Excel Templates