The Ratio Analysis Excel Template for Retail Stores provides a streamlined way to evaluate financial performance by calculating key metrics such as profitability, liquidity, and efficiency ratios. This customizable template helps retail managers quickly assess business health and make data-driven decisions. Designed for ease of use, it supports accurate analysis and improved financial planning within the retail sector.
Gross Profit Margin Analysis Excel Template for Retail Stores
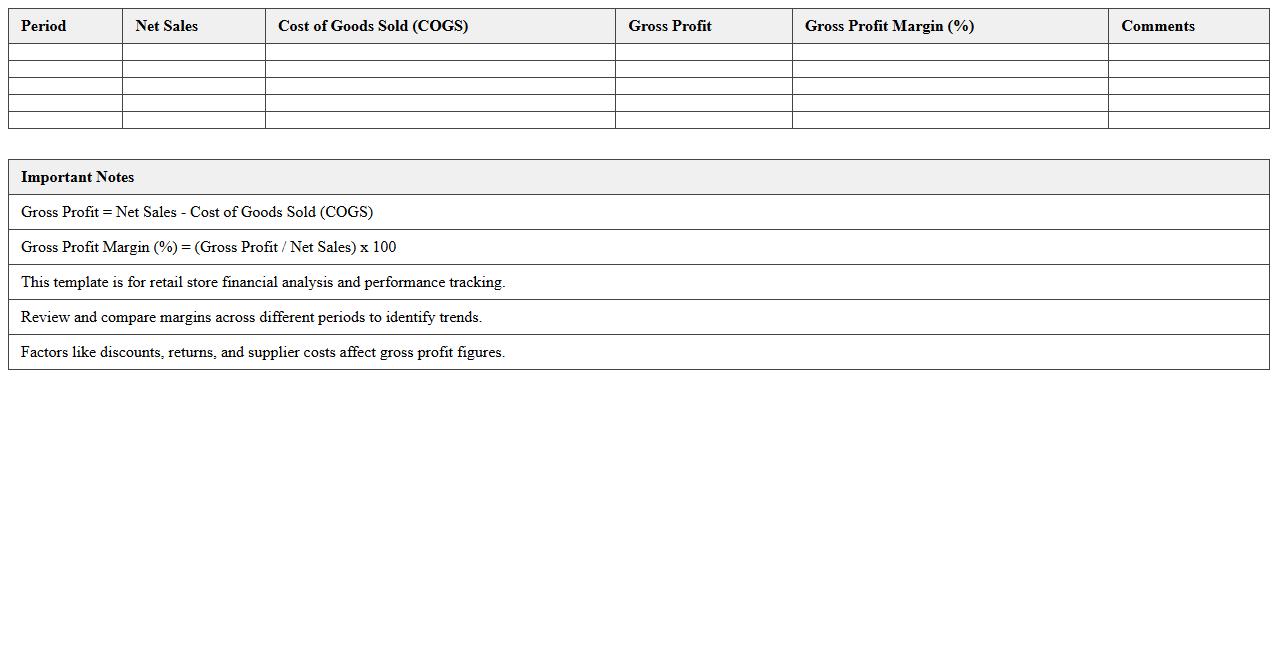
The
Gross Profit Margin Analysis Excel Template for Retail Stores is a specialized tool designed to calculate and visualize the profitability of retail businesses by comparing revenue and cost of goods sold. This template streamlines financial analysis, enabling store managers to identify trends, optimize pricing strategies, and make informed decisions to enhance profit margins. Using this document helps retailers monitor performance accurately and drive sustainable growth through detailed margin insights.
Inventory Turnover Ratio Excel Template for Retail Industry
The
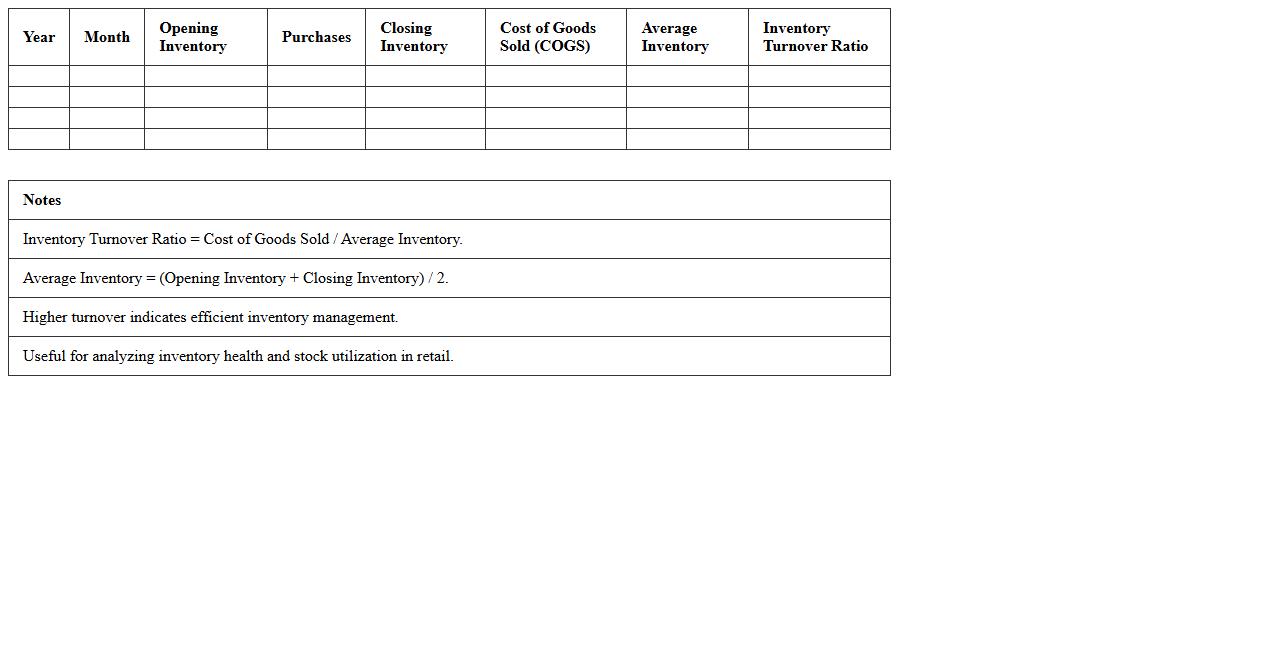
Inventory Turnover Ratio Excel Template for Retail Industry is a powerful tool designed to calculate and analyze the efficiency of inventory management by measuring how often inventory is sold and replaced over a given period. This template helps retail businesses optimize stock levels, reduce carrying costs, and improve cash flow by providing clear insights into product demand and inventory performance. By leveraging automated calculations and visual reports, retailers can make data-driven decisions to enhance supply chain operations and maximize profitability.
Quick Ratio Calculation Excel Spreadsheet for Retail Businesses
The
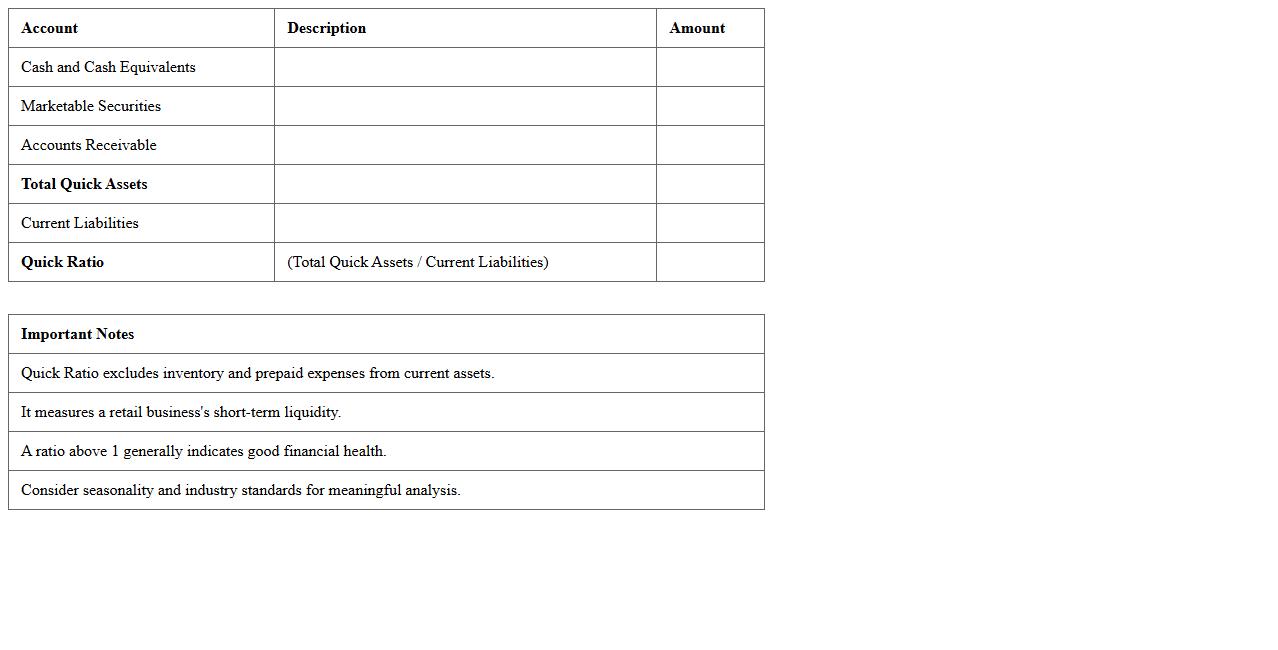
Quick Ratio Calculation Excel Spreadsheet for retail businesses is a financial tool designed to measure a company's short-term liquidity by comparing its most liquid assets to current liabilities. This spreadsheet enables retailers to quickly assess their ability to meet immediate obligations without relying on inventory sales, providing an accurate snapshot of financial health. By using this tool, businesses can make informed decisions about cash flow management, credit policies, and operational efficiency.
Retail Store Debt to Equity Ratio Excel Template
The
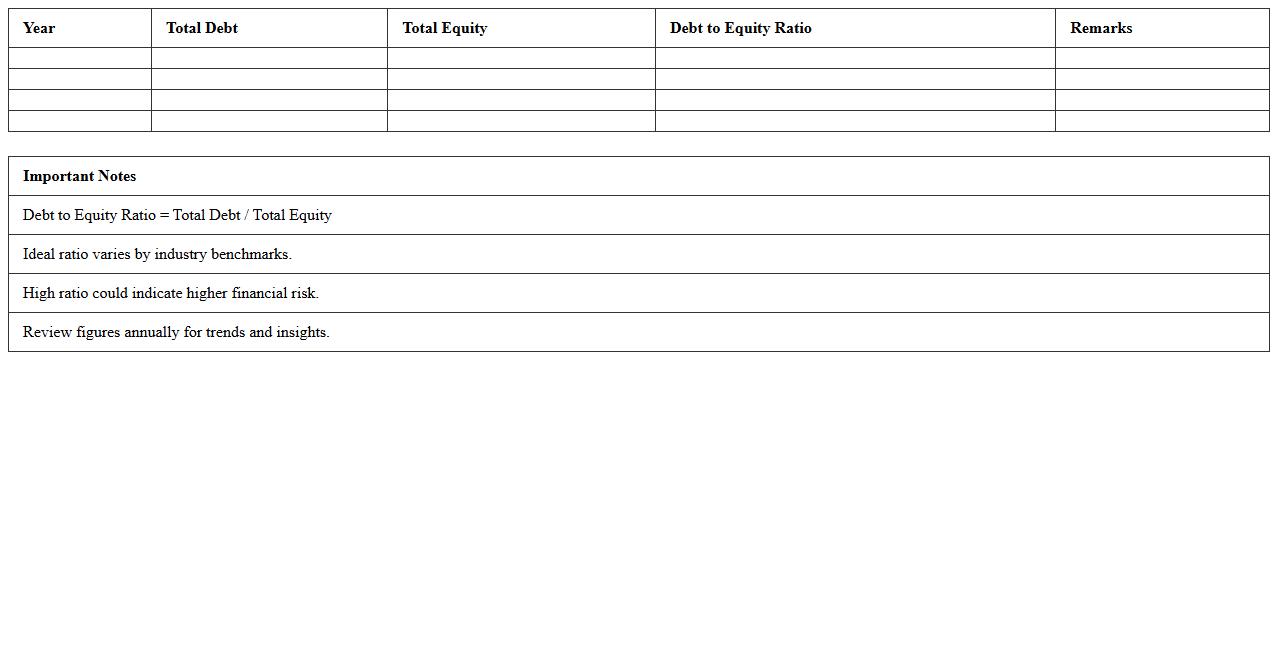
Retail Store Debt to Equity Ratio Excel Template document is a financial analysis tool designed to calculate and visualize the debt-to-equity ratio specifically for retail businesses. It helps store owners and financial analysts assess the proportion of company financing that comes from debt versus shareholder equity, enabling better decision-making on capital structure and risk management. Using this template streamlines data input and generates accurate reports, improving financial planning and investment strategies.
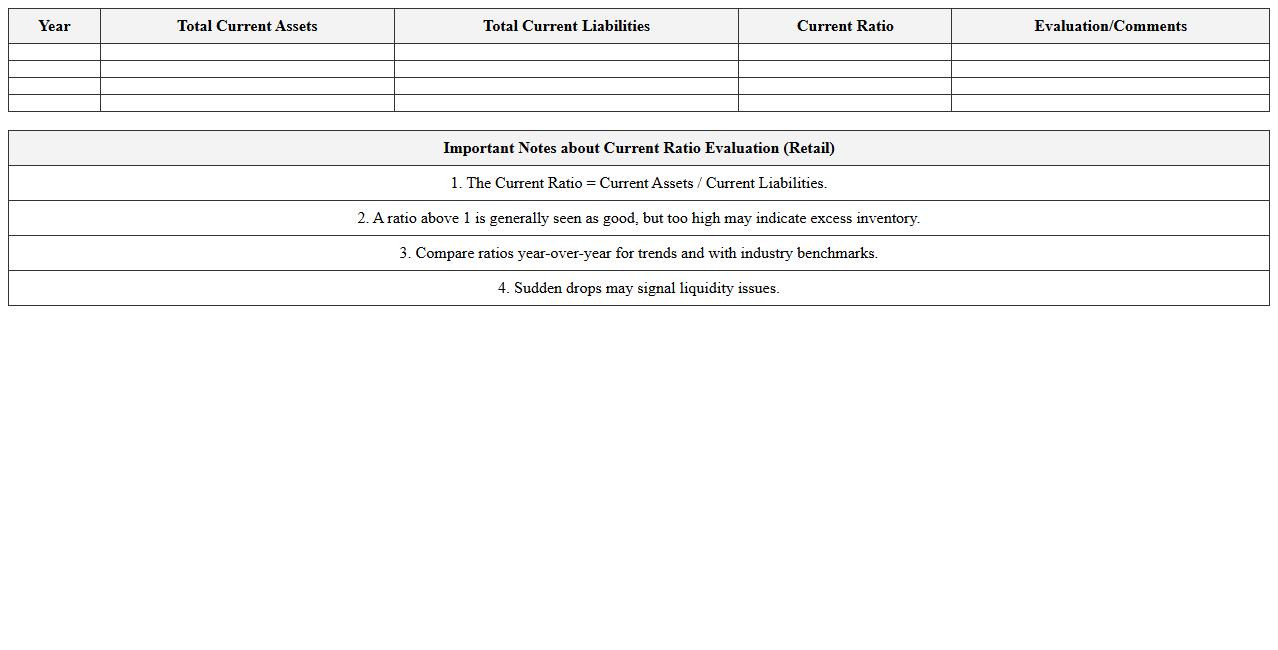
Current Ratio Evaluation Excel Template for Retail
The
Current Ratio Evaluation Excel Template for Retail is a financial analysis tool designed to accurately assess a retail business's short-term liquidity by comparing current assets to current liabilities. This template enables retailers to input their financial data systematically, providing clear visualizations and calculations that highlight their ability to meet short-term obligations. Utilizing this template helps improve cash flow management, supports informed decision-making, and strengthens overall financial stability in retail operations.
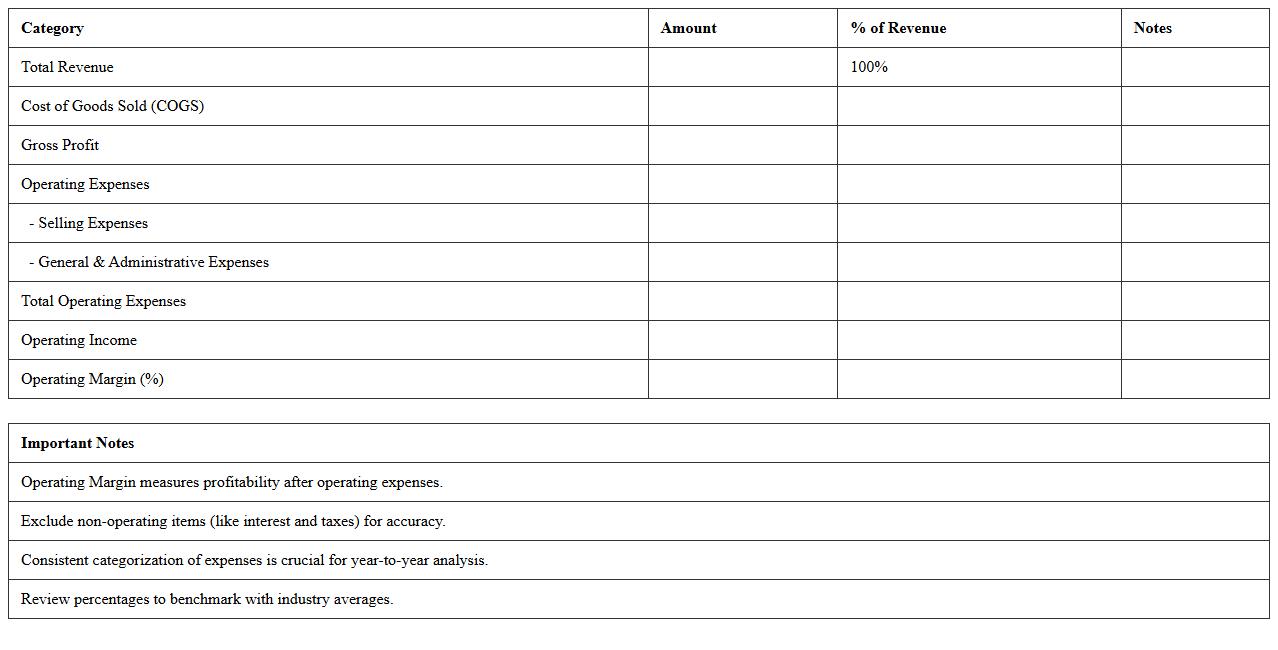
Operating Margin Analysis Excel Worksheet for Retailers
Operating Margin Analysis Excel Worksheet for Retailers is a comprehensive tool designed to calculate and visualize the profitability of retail operations by analyzing revenue and operating expenses. It helps retailers identify key cost drivers, optimize pricing strategies, and improve overall financial performance by providing detailed insights into gross profit, operating costs, and net operating margin. Using this worksheet enables businesses to make data-driven decisions that enhance efficiency and sustain long-term growth.
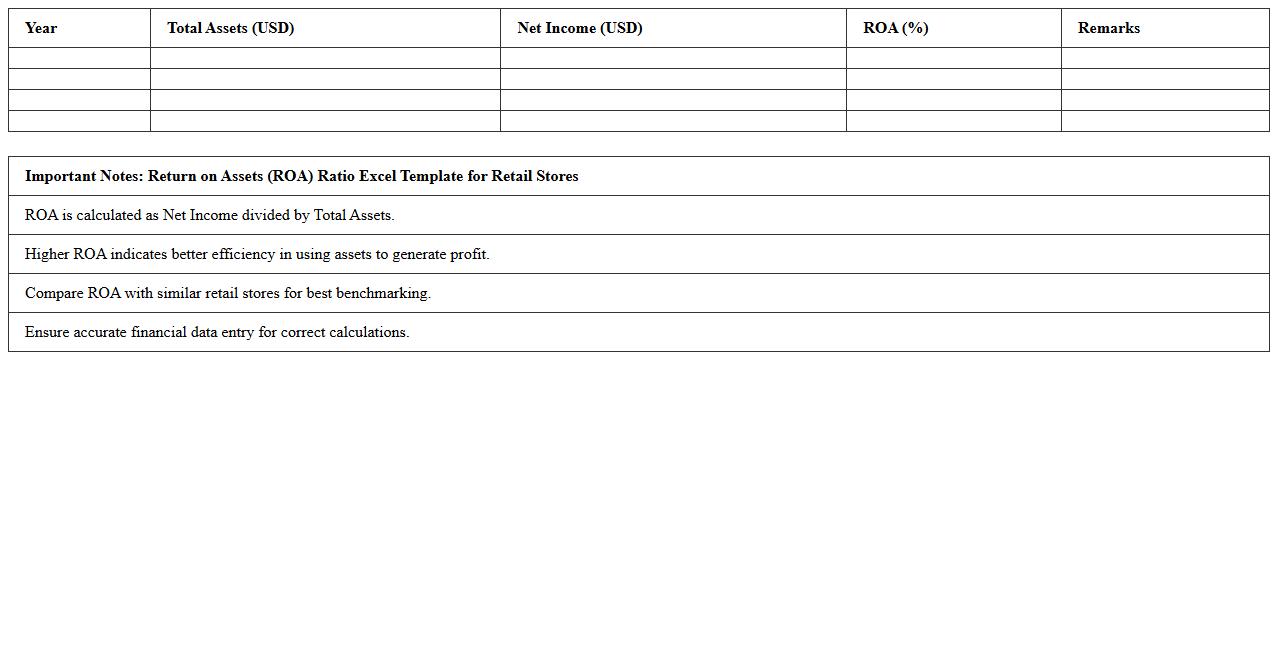
Return on Assets (ROA) Ratio Excel Template for Retail Stores
The
Return on Assets (ROA) Ratio Excel Template for Retail Stores is a financial analysis tool designed to calculate and evaluate the profitability of retail businesses relative to their total assets. This template helps retail managers and accountants efficiently input financial data to derive the ROA, providing a clear measure of how effectively assets generate profit. Using this template aids in making informed decisions on asset management and operational improvements to enhance overall store performance.
Receivables Turnover Ratio Excel Tracker for Retail Business
The
Receivables Turnover Ratio Excel Tracker for retail business is a powerful tool designed to monitor and analyze the efficiency of a company's credit and collections processes. By calculating how effectively receivables are being converted into cash, this tracker helps businesses identify trends, optimize cash flow, and reduce outstanding debts. Retailers benefit from improved financial management, enabling better decision-making and enhanced operational performance.
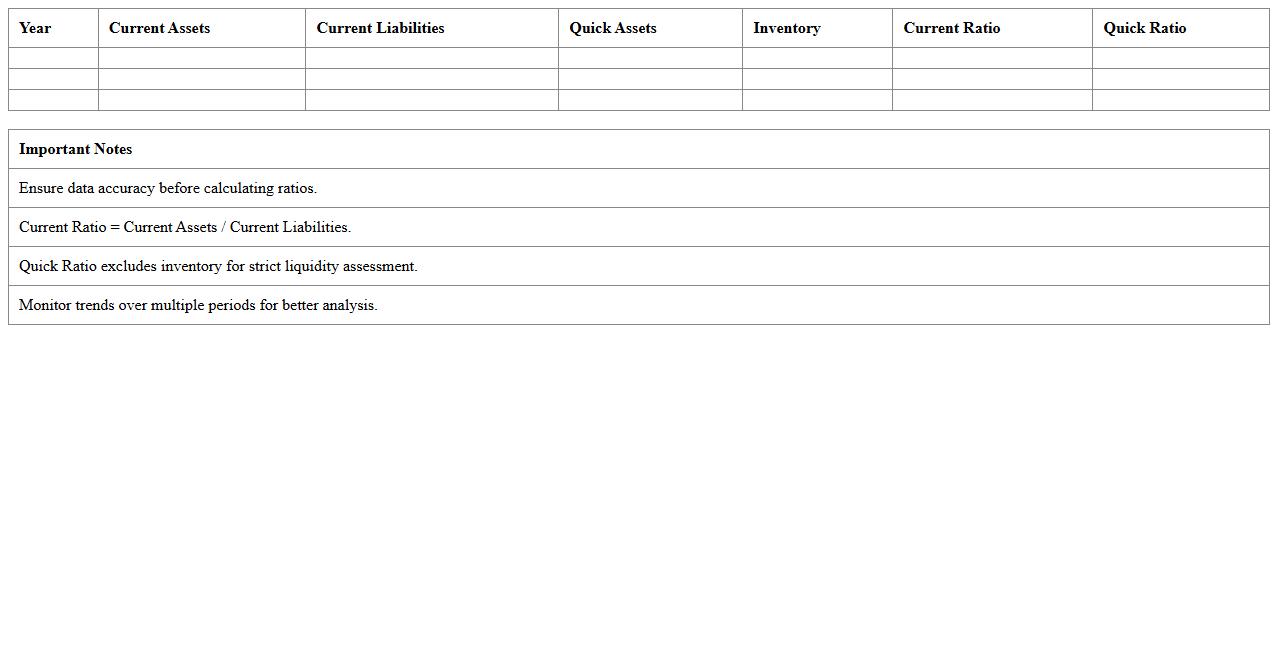
Retail Store Liquidity Ratio Excel Template
The
Retail Store Liquidity Ratio Excel Template is a financial tool designed to calculate and analyze a retail business's ability to cover short-term liabilities with liquid assets. This template automates the computation of key liquidity ratios such as the current ratio and quick ratio, providing clear insights into cash flow management and financial stability. By using this document, retailers can make informed decisions regarding inventory purchases, credit policies, and operational expenses to maintain optimal liquidity levels.
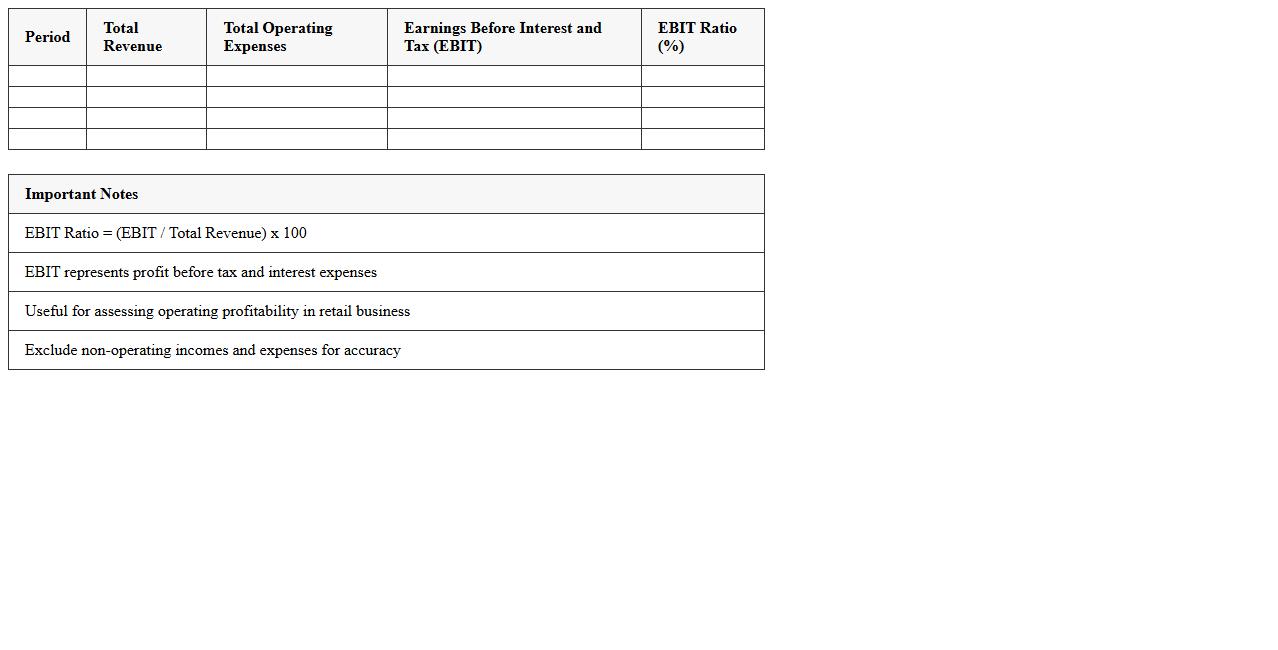
Earnings Before Interest and Tax (EBIT) Ratio Excel Sheet for Retail
The
Earnings Before Interest and Tax (EBIT) Ratio Excel Sheet for Retail document calculates the operational profitability of retail businesses by analyzing EBIT relative to sales revenue. It enables users to assess core business performance excluding the effects of financing and tax expenses, facilitating accurate comparisons across retail companies. This tool aids in financial decision-making, budgeting, and performance benchmarking within the retail sector by providing clear visibility into operational efficiency.
Which key retail ratios can be automated in an Excel template for monthly performance tracking?
An Excel template can automate essential retail ratios such as Gross Margin Ratio, Inventory Turnover, and Sales per Square Foot. These ratios enable businesses to monitor profitability, inventory efficiency, and sales productivity on a monthly basis. Automating these metrics ensures consistent performance tracking and quick decision-making.
How to customize Excel formulas to analyze stock turnover specific to retail categories?
To analyze stock turnover by retail category, use Excel formulas incorporating IF and SUMIFS functions for targeted data aggregation. Create dynamic ranges and category filters that reflect distinct inventory groups, enabling detailed turnover analysis. This customization helps retailers optimize inventory levels and reduce stockouts across various product categories.
What Excel method best forecasts cash conversion cycles for retail inventory?
The cash conversion cycle can be forecasted effectively using Excel's combination of moving averages and trend analysis with historical inventory, receivables, and payables data. Incorporating the NPV function alongside timelines allows for accurate future cash flow estimations. This approach offers retailers clear visibility into working capital cycles and operational efficiency.
Which conditional formatting rules highlight at-risk margins in retail ratio analysis?
Applying conditional formatting rules in Excel such as color scales and data bars can highlight at-risk margins below predefined threshold percentages. Use formulas to trigger formatting when gross margin ratios fall under acceptable limits, signaling potential financial issues. This visual aid assists in promptly identifying and addressing profitability concerns.
How to link POS data with Excel for real-time gross margin ratio updates?
Integrate Point of Sale (POS) data with Excel using Power Query or live data connections to enable real-time updates of gross margin ratios. Automated data refreshes pull sales and cost data directly into the spreadsheet, maintaining accuracy and timeliness. This connectivity supports immediate insights into retail performance and improved margin management.
More Analysis Excel Templates