The Customer Satisfaction Analysis Excel Template for Service Industries provides an efficient way to track and evaluate client feedback systematically. It includes customizable charts and data entry fields designed to measure key performance indicators, helping businesses identify strengths and areas for improvement. This template enhances decision-making by offering clear insights into customer satisfaction levels within service-based operations.
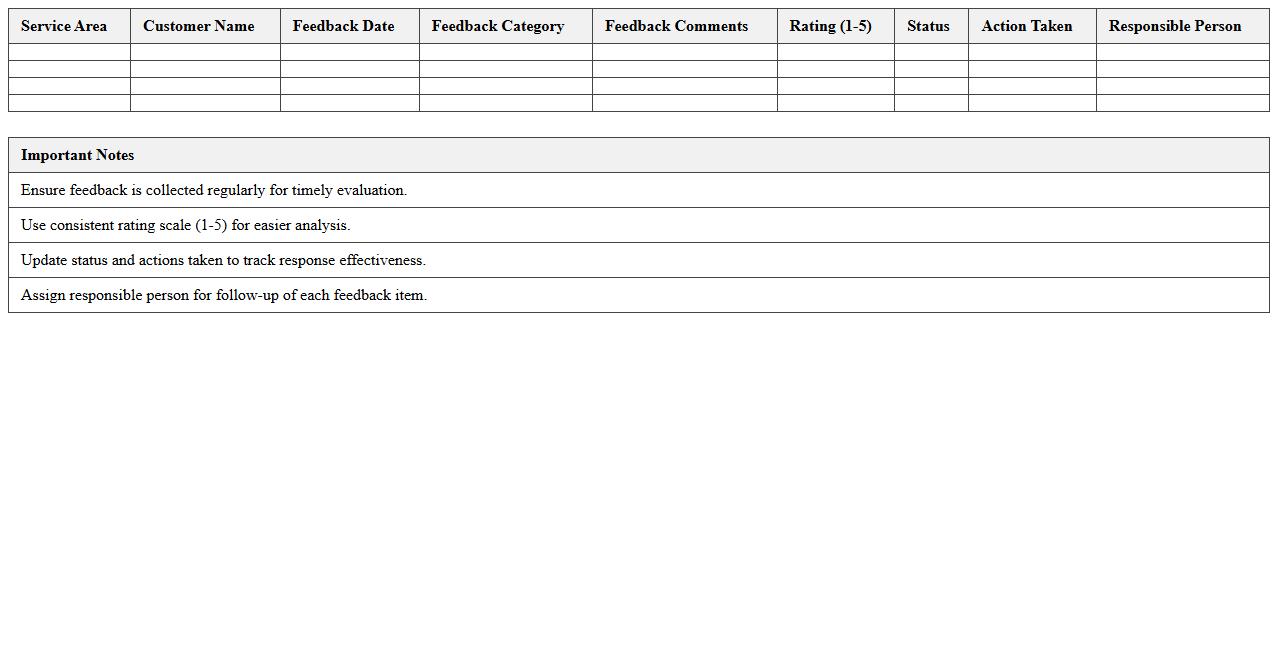
Customer Complaint Tracking Log Excel Template
The
Customer Complaint Tracking Log Excel Template is a structured document designed to record, monitor, and analyze customer complaints efficiently. It helps businesses systematically track complaint details, response actions, and resolution status, enabling improved customer service management and timely issue resolution. Utilizing this template enhances data organization, facilitates trend analysis, and supports continuous improvement in customer satisfaction.
Service Feedback Summary Dashboard Excel Template
The
Service Feedback Summary Dashboard Excel Template is a powerful tool designed to compile, analyze, and visualize customer feedback efficiently. It aggregates service ratings, comments, and trends into an interactive dashboard, enabling quick identification of areas needing improvement. This template enhances decision-making by providing clear insights into customer satisfaction metrics and service quality over time.
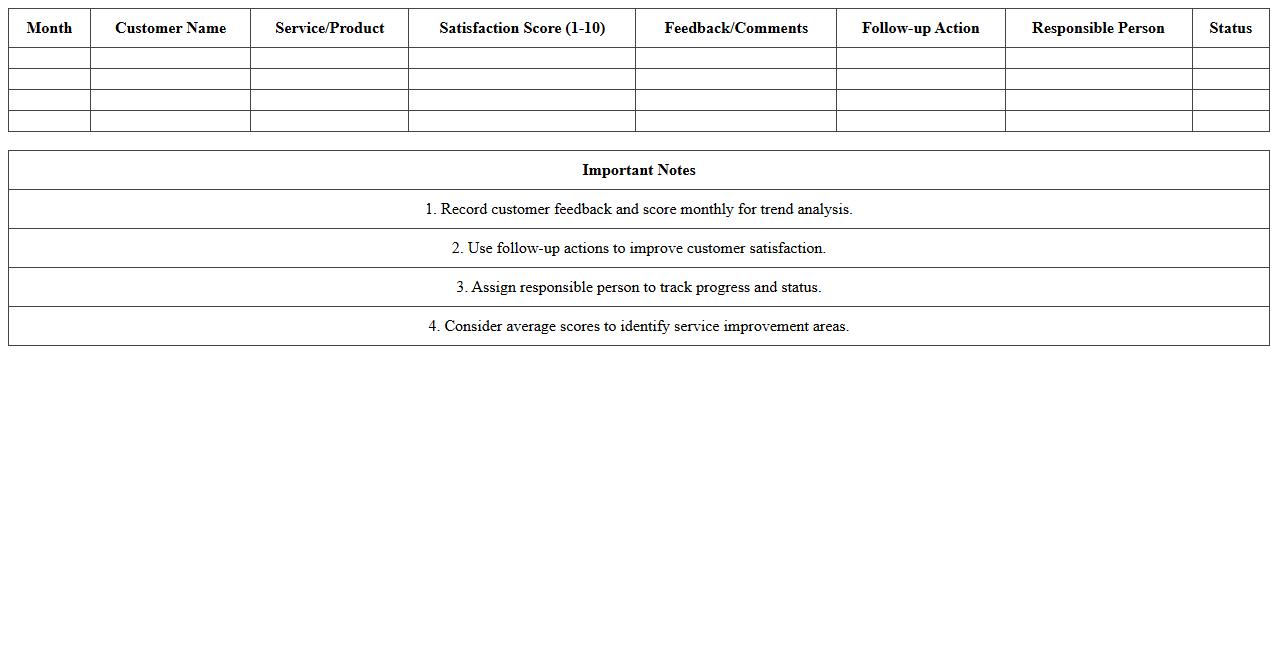
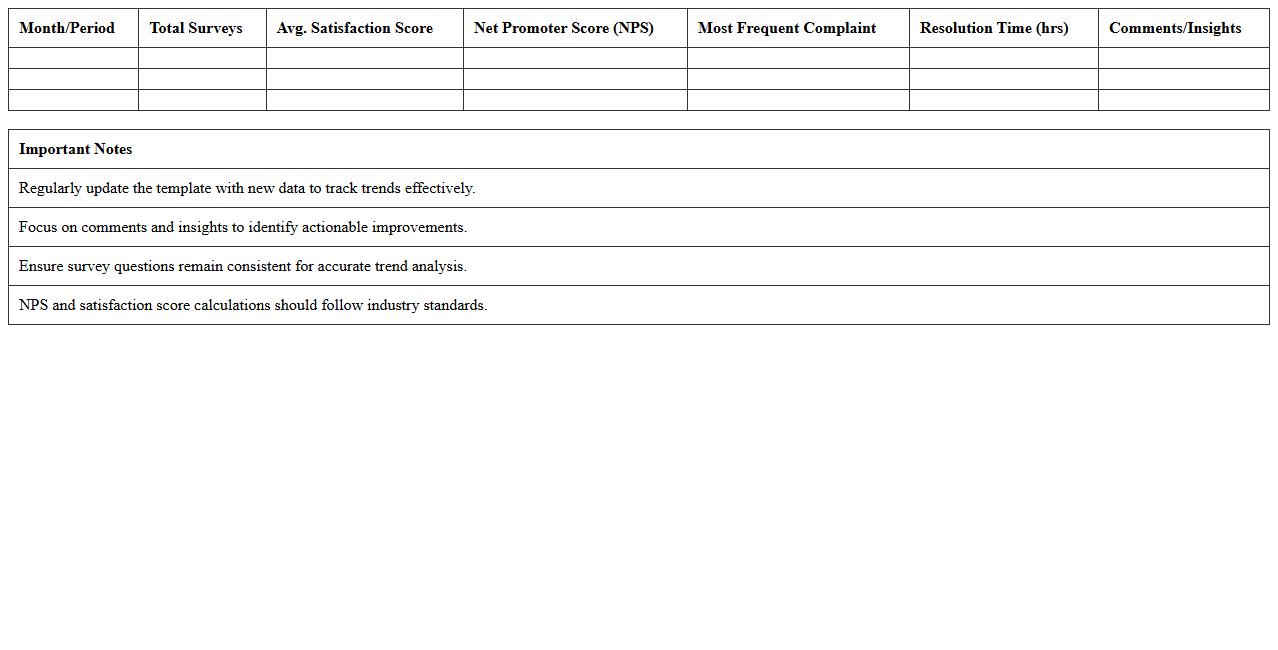
Monthly Customer Satisfaction Scorecard Excel Template
The
Monthly Customer Satisfaction Scorecard Excel Template document is a structured tool designed to track, analyze, and visualize customer feedback and satisfaction metrics over a monthly period. It enables businesses to identify trends, monitor key performance indicators (KPIs) such as Net Promoter Score (NPS), Customer Satisfaction Score (CSAT), and Customer Effort Score (CES), allowing for data-driven decisions that improve service quality. This template streamlines reporting, enhances transparency, and supports continuous improvement initiatives by consolidating customer insights into an easy-to-use, customizable format.
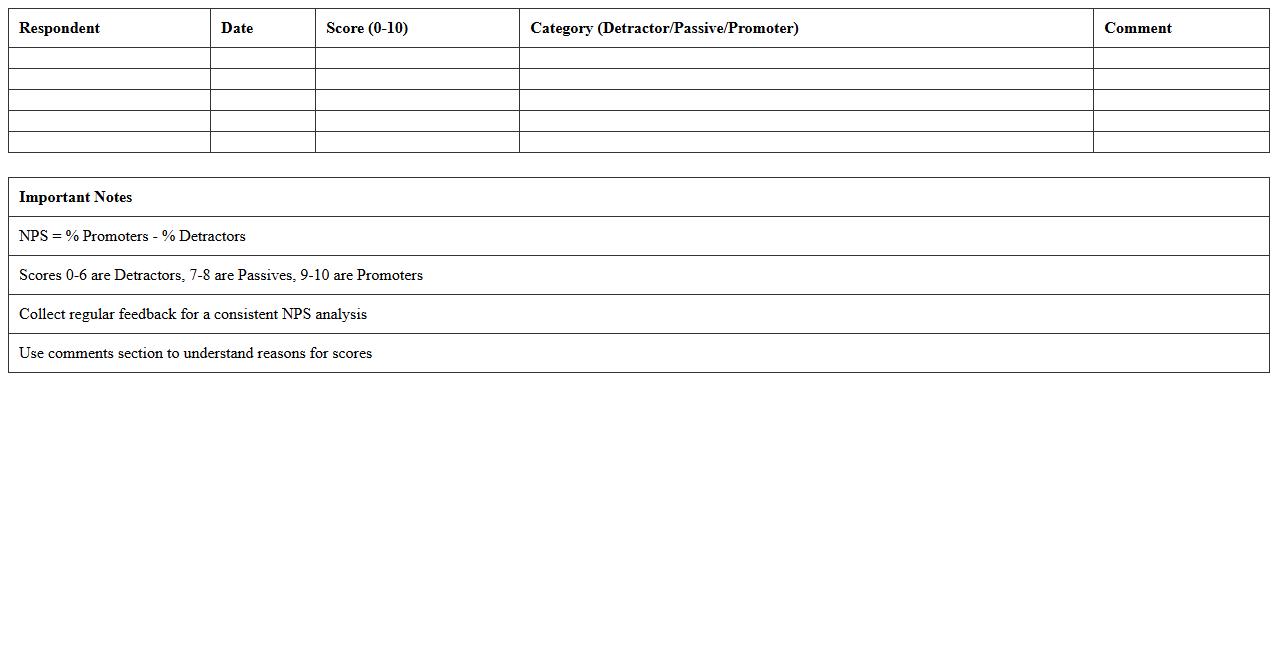
Net Promoter Score Analysis Excel Template
The
Net Promoter Score Analysis Excel Template is a practical tool designed to calculate and visualize customer loyalty and satisfaction by organizing survey data efficiently. This template enables businesses to segment promoters, passives, and detractors, facilitating targeted strategies to enhance customer experience. Utilizing this document helps improve decision-making processes by providing clear insights into customer feedback trends and overall brand perception.
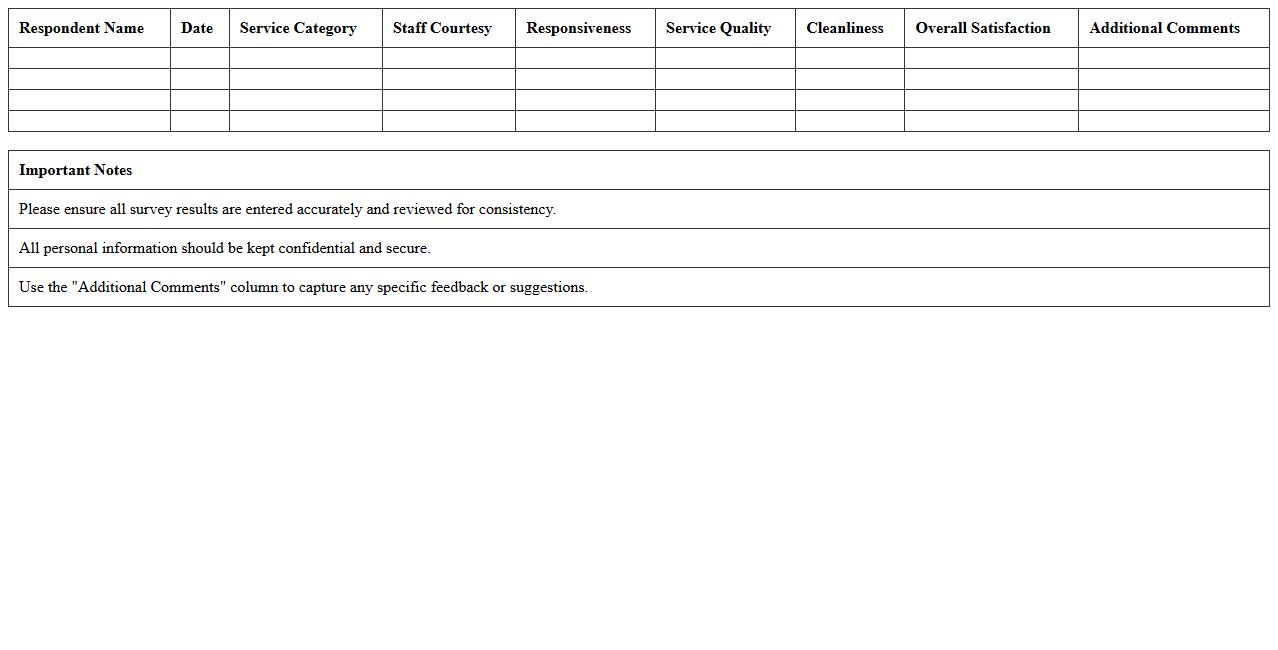
Service Quality Survey Results Excel Template
The
Service Quality Survey Results Excel Template is a structured tool designed to collect, organize, and analyze feedback from customers regarding the quality of services provided. It enables businesses to quantify customer satisfaction, identify areas for improvement, and track performance trends over time through customizable charts and summary tables. By utilizing this template, organizations can make data-driven decisions that enhance service delivery and boost customer loyalty.
Customer Experience Trend Analysis Excel Template
The
Customer Experience Trend Analysis Excel Template is a structured spreadsheet designed to track and analyze customer feedback, satisfaction scores, and behavioral patterns over time. It helps businesses identify key trends, spot emerging issues, and measure the effectiveness of service improvements by organizing data into visual charts and actionable insights. Using this template enhances decision-making processes by providing a clear, data-driven understanding of customer experience dynamics.
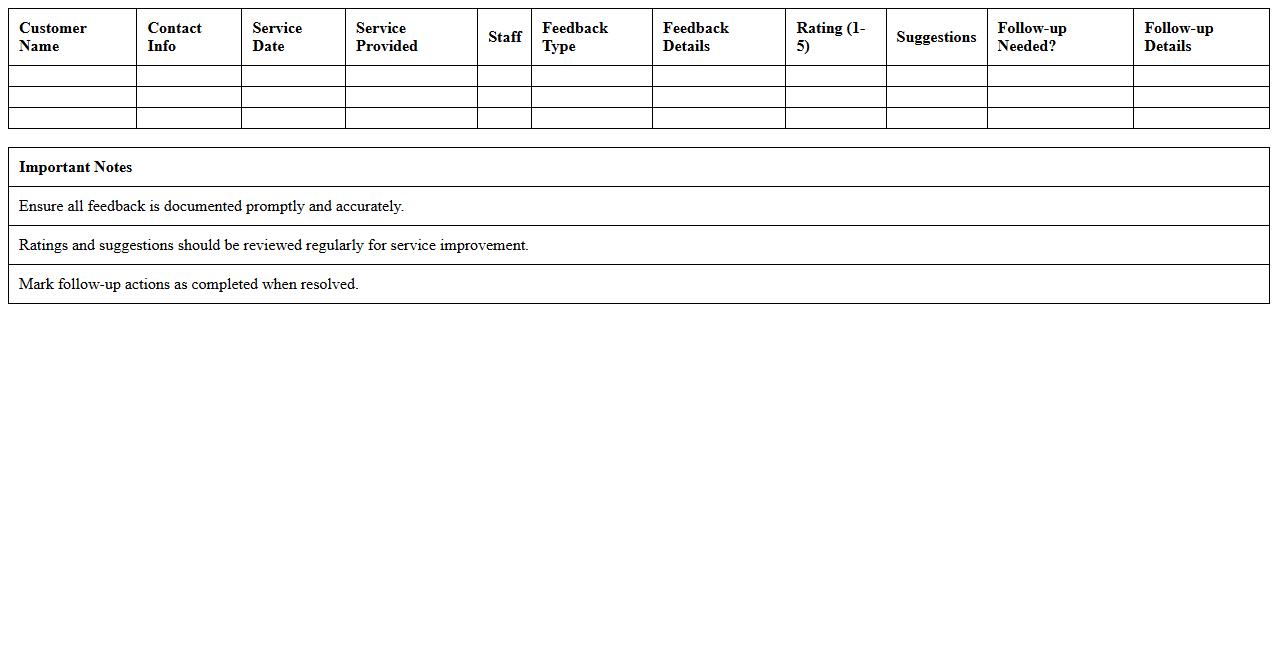
Post-Service Feedback Collection Form Excel Template
The
Post-Service Feedback Collection Form Excel Template is a structured spreadsheet designed to gather customer opinions and experiences after receiving a service. It enables businesses to systematically record, analyze, and track client satisfaction, helping identify areas of improvement and enhance service quality. Utilizing this template promotes data-driven decision making, boosting customer retention and overall service excellence.
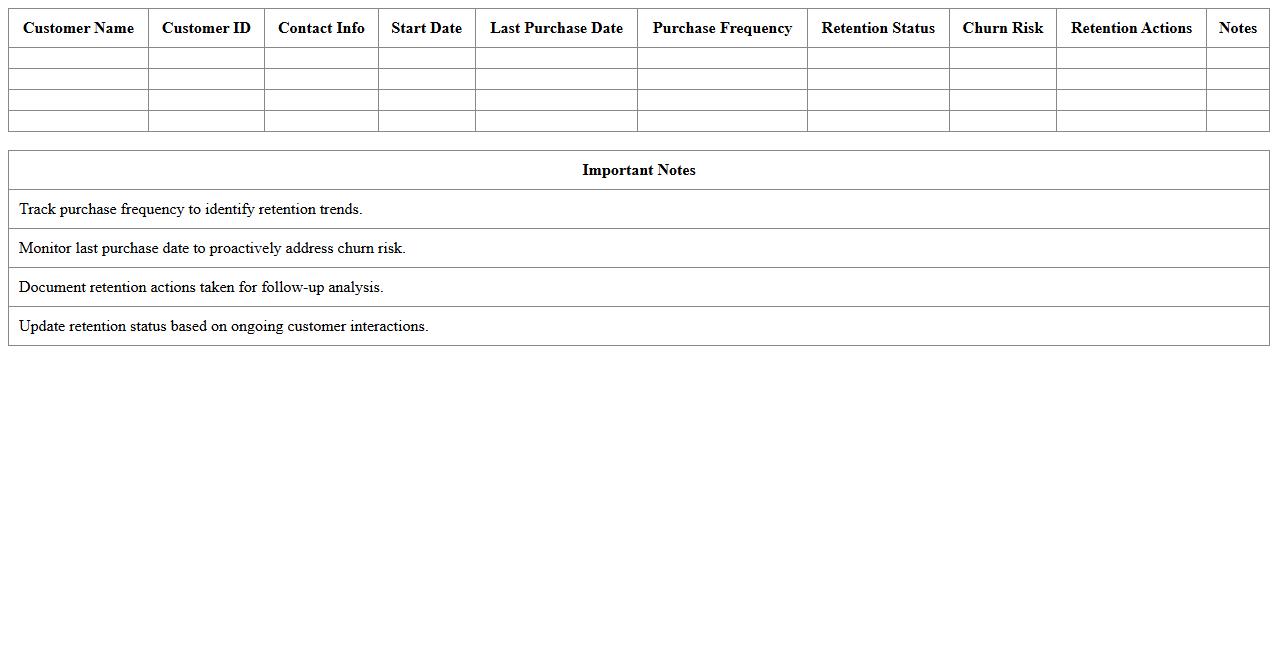
Customer Retention Performance Report Excel Template
The
Customer Retention Performance Report Excel Template is a structured spreadsheet designed to track and analyze customer loyalty metrics, including churn rates, repeat purchase frequency, and customer lifetime value. This template helps businesses identify patterns in customer behavior, enabling data-driven decisions to improve retention strategies and increase profitability. By visualizing key performance indicators, it allows teams to monitor retention efforts efficiently and allocate resources effectively.
Incident Resolution Time Tracker Excel Template
The
Incident Resolution Time Tracker Excel Template is a specialized spreadsheet designed to monitor and record the duration required to resolve various incidents or issues. It enables organizations to analyze resolution efficiency, identify bottlenecks, and improve overall response times. By systematically tracking incident resolution times, this template helps enhance service quality and supports better resource allocation in incident management processes.
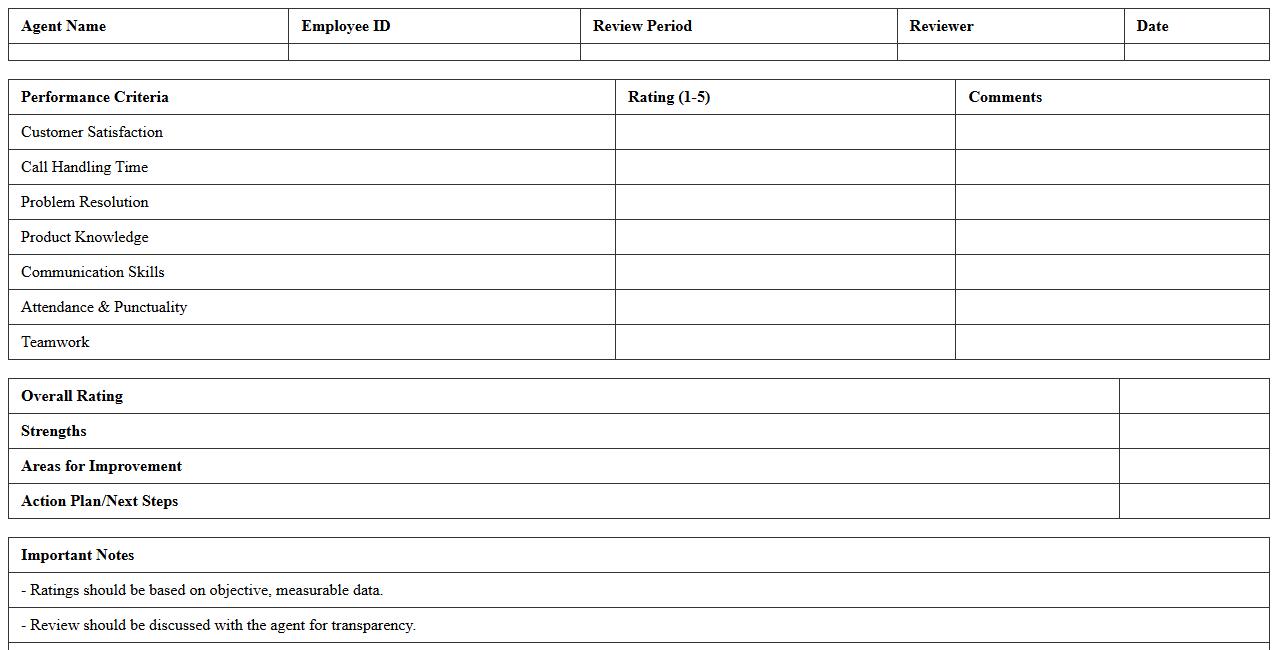
Customer Service Agent Performance Review Excel Template
The
Customer Service Agent Performance Review Excel Template is a structured document designed to track and evaluate the efficiency, communication skills, and problem-solving abilities of customer service agents. It allows managers to systematically record key performance indicators such as response time, resolution rate, and customer feedback, facilitating data-driven decisions. This template enhances employee development, improves service quality, and ensures consistent performance assessments across the team.
Which Excel formulas are most effective for calculating Customer Satisfaction Scores in service industries?
To calculate Customer Satisfaction Scores (CSAT), the AVERAGEIF formula is highly effective for averaging satisfaction ratings based on specific criteria. The COUNTIF function helps in counting positive or negative responses, aiding in precise CSAT calculations. Additionally, formulas like SUMPRODUCT are useful for weighted scoring when considering various aspects of customer feedback.
How can conditional formatting in Excel highlight low satisfaction responses in survey data?
Conditional Formatting can be used to automatically highlight survey responses below a certain threshold, such as satisfaction scores less than 3, by applying color scales or specific fill colors. This visual aid helps quickly identify areas requiring attention without manually scanning through data. Using custom rules, Excel allows dynamic formatting based on cell values to emphasize low satisfaction effectively.
What pivot table techniques best visualize trends in service feedback over time?
Using pivot tables with date grouping allows analysts to visualize customer feedback trends monthly or quarterly, providing valuable time-based insights. Incorporating Filters and Slicers enhances interactivity, making it easier to analyze specific service categories or demographics. Summarizing satisfaction scores with average or count measures in the pivot table offers a clear picture of changing customer sentiment over time.
How can Excel automate alerts for NPS (Net Promoter Score) drops in customer feedback letters?
Excel can automate NPS drop alerts by using formulas such as IF combined with conditional formatting to flag scores that fall below a preset threshold. VBA macros or Power Automate can be programmed to send email notifications when significant decreases are detected. This automation ensures timely responses to customer dissatisfaction trends without manual monitoring.
Which Excel chart types most clearly present customer satisfaction distributions for service sectors?
Bar charts and column charts are effective for comparing customer satisfaction scores across different service categories or time periods. Pie charts provide a simple way to visualize the proportion of promoters, passives, and detractors in care services. Additionally, stacked bar charts can display multiple satisfaction levels together, offering a comprehensive overview of customer feedback distribution.
More Analysis Excel Templates