The Sensitivity Analysis Excel Template for Investment Portfolios helps investors evaluate how changes in key variables impact portfolio performance. This tool allows users to input different assumptions and instantly see the effects on returns, risk, and asset allocation. It enhances decision-making by providing a clear visualization of potential investment outcomes under varying market conditions.
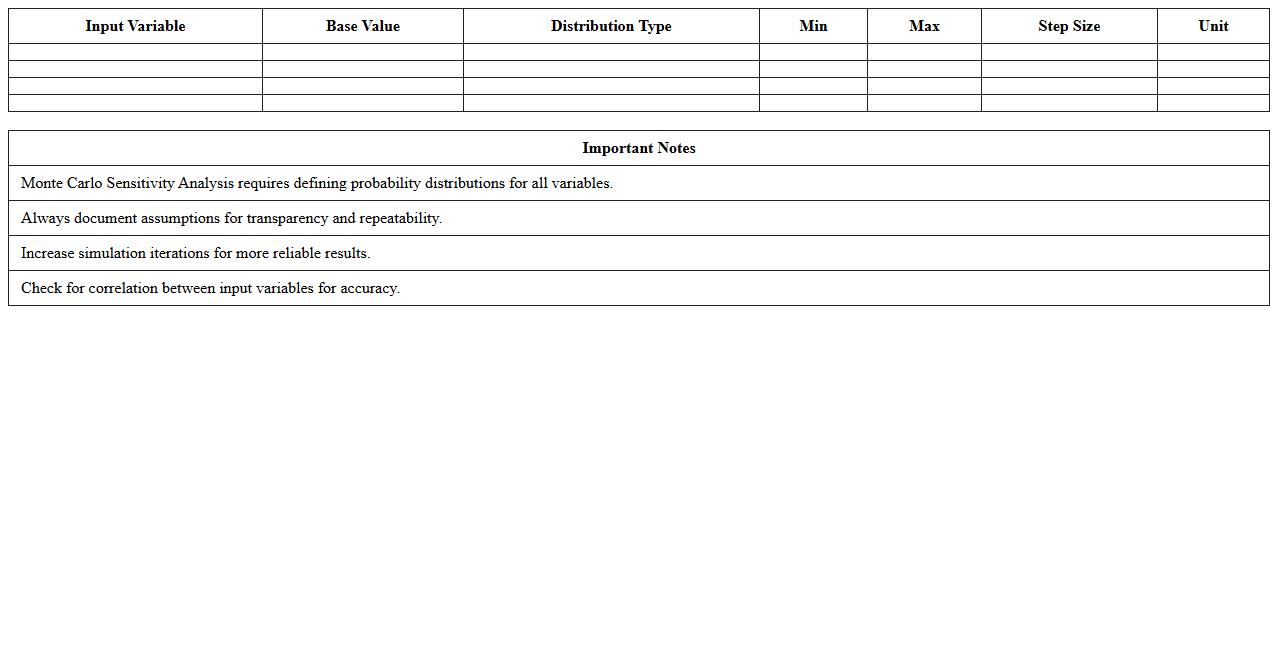
Monte Carlo Sensitivity Analysis Excel Template
The
Monte Carlo Sensitivity Analysis Excel Template is a powerful tool designed to evaluate how changes in input variables impact the outcomes of a complex model by running thousands of simulations with random variable variations. It helps identify critical factors that significantly influence results, improving decision-making accuracy in finance, engineering, and project management. By visualizing the variation and sensitivity of outputs, users can prioritize risk management strategies and optimize resource allocation effectively.
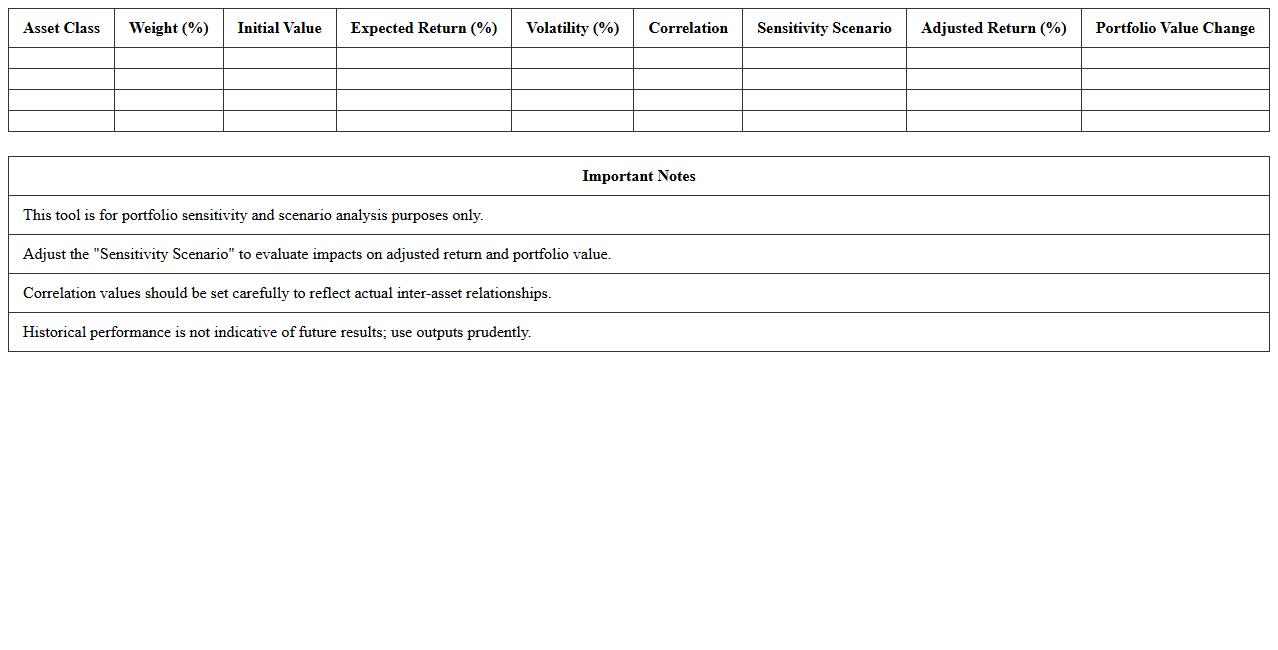
Multi-Asset Portfolio Sensitivity Tool
The
Multi-Asset Portfolio Sensitivity Tool document provides a detailed analysis framework to assess how different asset classes within a portfolio respond to various market conditions and risk factors. It enables investors and portfolio managers to identify vulnerabilities, quantify exposure to interest rate changes, inflation, and economic shifts, and optimize asset allocation accordingly. By using this tool, stakeholders can make informed decisions to enhance portfolio resilience and improve performance under different financial scenarios.
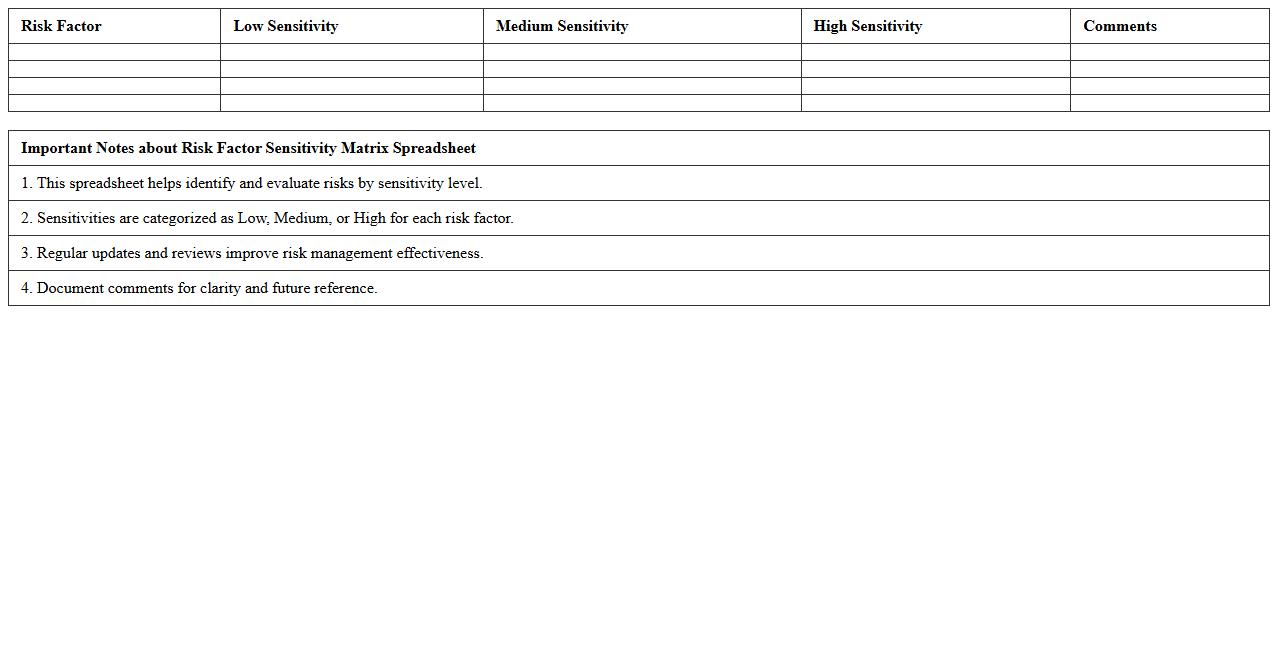
Risk Factor Sensitivity Matrix Spreadsheet
The
Risk Factor Sensitivity Matrix Spreadsheet is a structured document that quantifies the impact of various risk factors on project outcomes or financial models by assigning sensitivity values. It helps identify which variables have the most significant influence on performance metrics, enabling prioritization of risk mitigation efforts and resource allocation. This tool enhances decision-making by providing a clear visualization of potential vulnerabilities and their relative importance within complex systems.
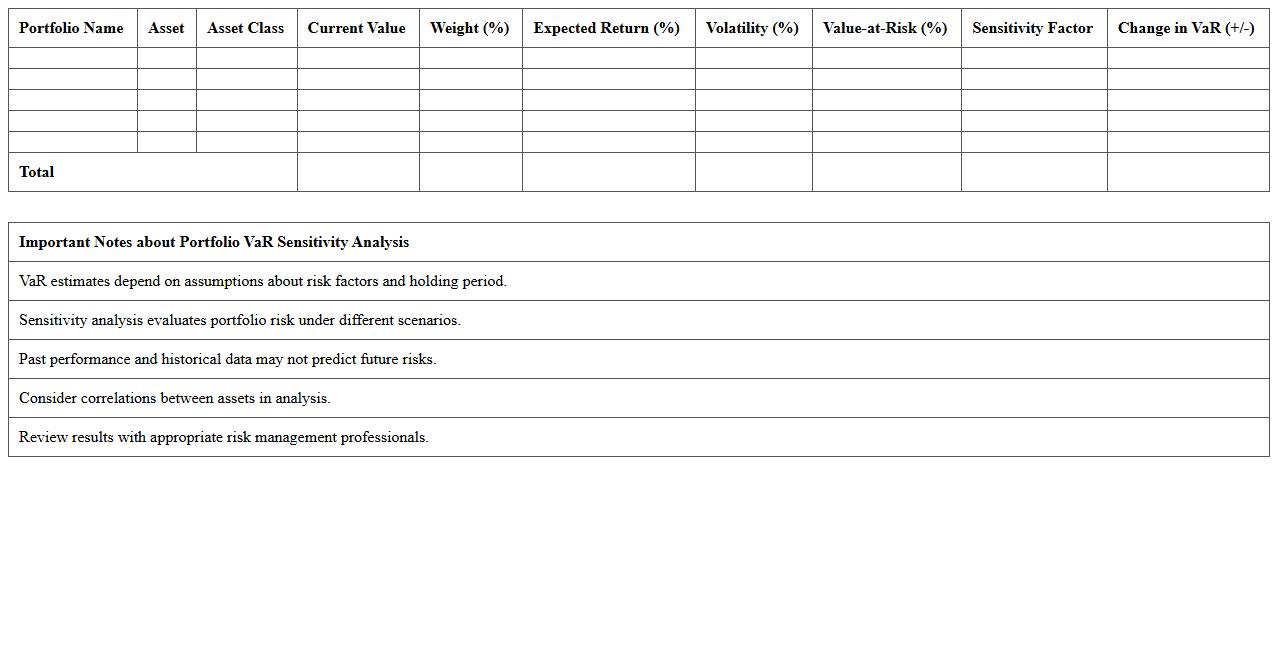
Portfolio Value-at-Risk Sensitivity Analysis Sheet
The
Portfolio Value-at-Risk Sensitivity Analysis Sheet is a document that quantifies how changes in key risk factors affect the overall value-at-risk (VaR) of a portfolio. It helps risk managers identify vulnerabilities by analyzing the impact of varying market conditions, such as interest rates, volatility, and asset correlations, on portfolio risk metrics. This analysis supports informed decision-making by highlighting risk exposures and enabling proactive risk mitigation strategies.
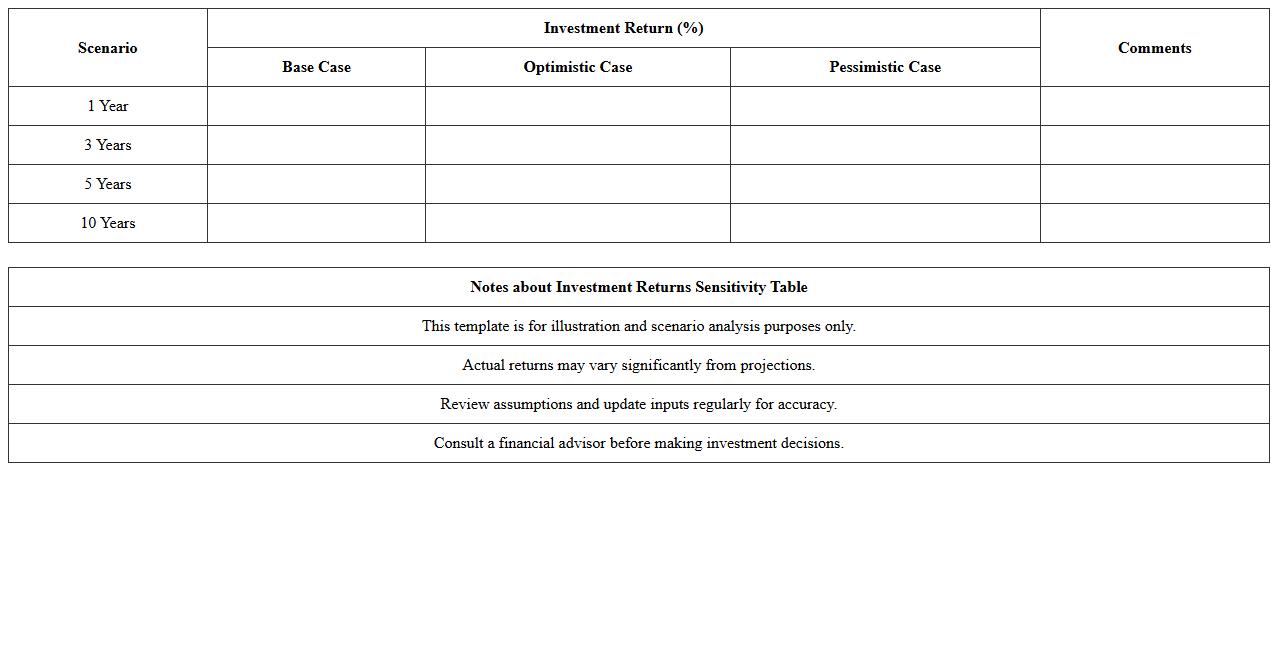
Investment Returns Sensitivity Table Template
An
Investment Returns Sensitivity Table Template document is a structured tool designed to analyze how varying input assumptions affect potential investment outcomes. It allows investors to model different scenarios by adjusting key variables like interest rates, growth rates, and time periods to assess risk and reward dynamics effectively. This template is useful for making informed financial decisions, enhancing portfolio optimization, and understanding the impact of uncertainties on investment performance.
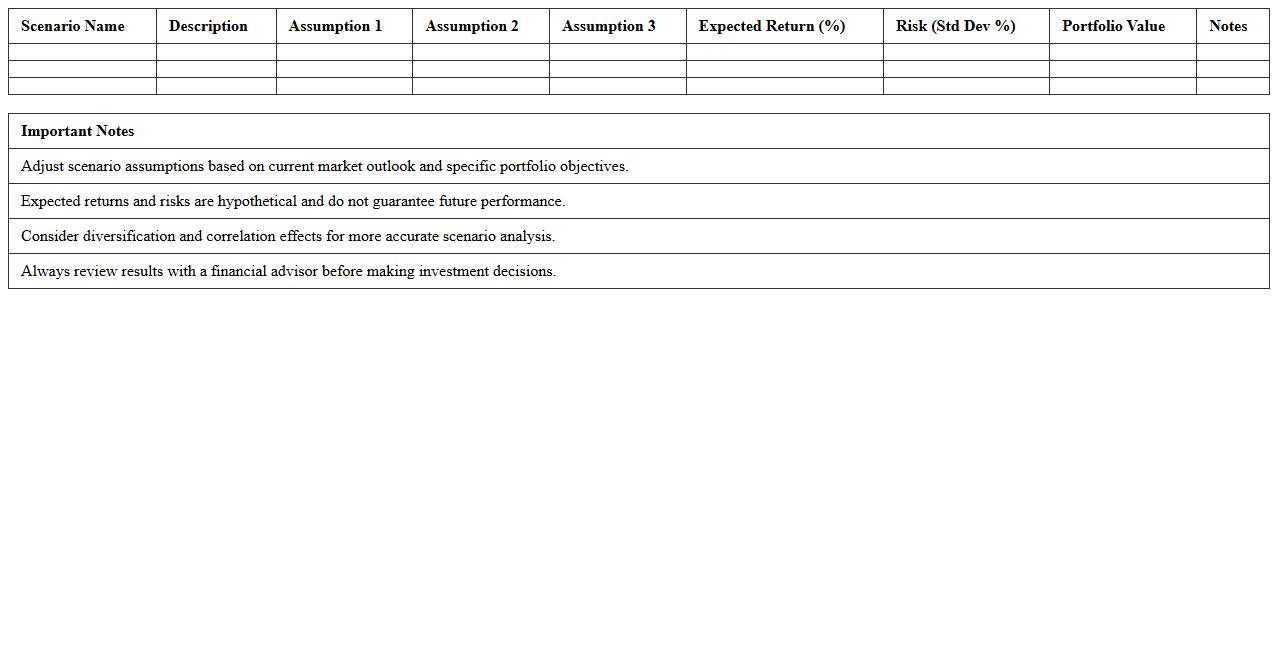
Scenario Analysis Excel Model for Portfolios
The
Scenario Analysis Excel Model for Portfolios document is a detailed tool designed to evaluate potential financial outcomes by simulating various market conditions and investment scenarios. It allows investors and portfolio managers to assess risk, forecast returns, and make informed decisions by analyzing the impact of different economic variables on portfolio performance. This model enhances strategic planning by providing a structured framework to visualize possible futures and optimize asset allocation accordingly.
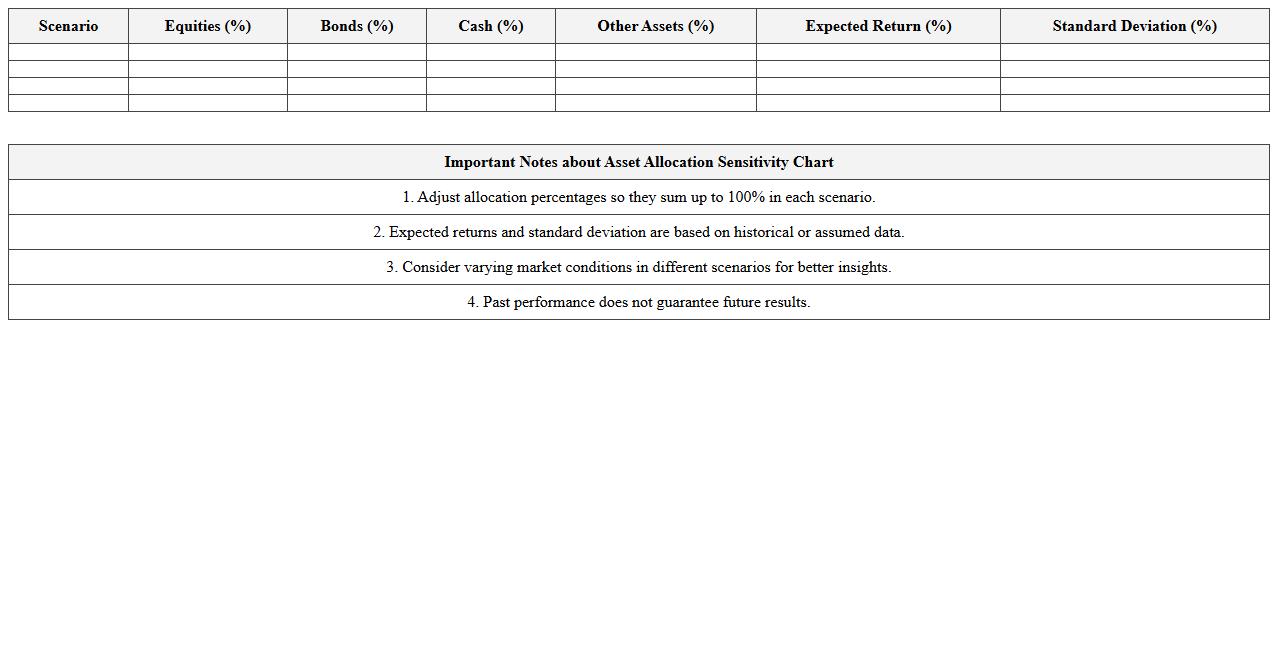
Asset Allocation Sensitivity Chart
The
Asset Allocation Sensitivity Chart document illustrates how different portfolio asset allocations respond to various market scenarios and risk factors, helping investors understand potential changes in portfolio value. By visualizing sensitivity across asset classes, it enables better-informed decisions to optimize risk and return trade-offs tailored to specific investment goals. This tool is essential for managing diversification, assessing exposure to economic shifts, and enhancing overall portfolio resilience.
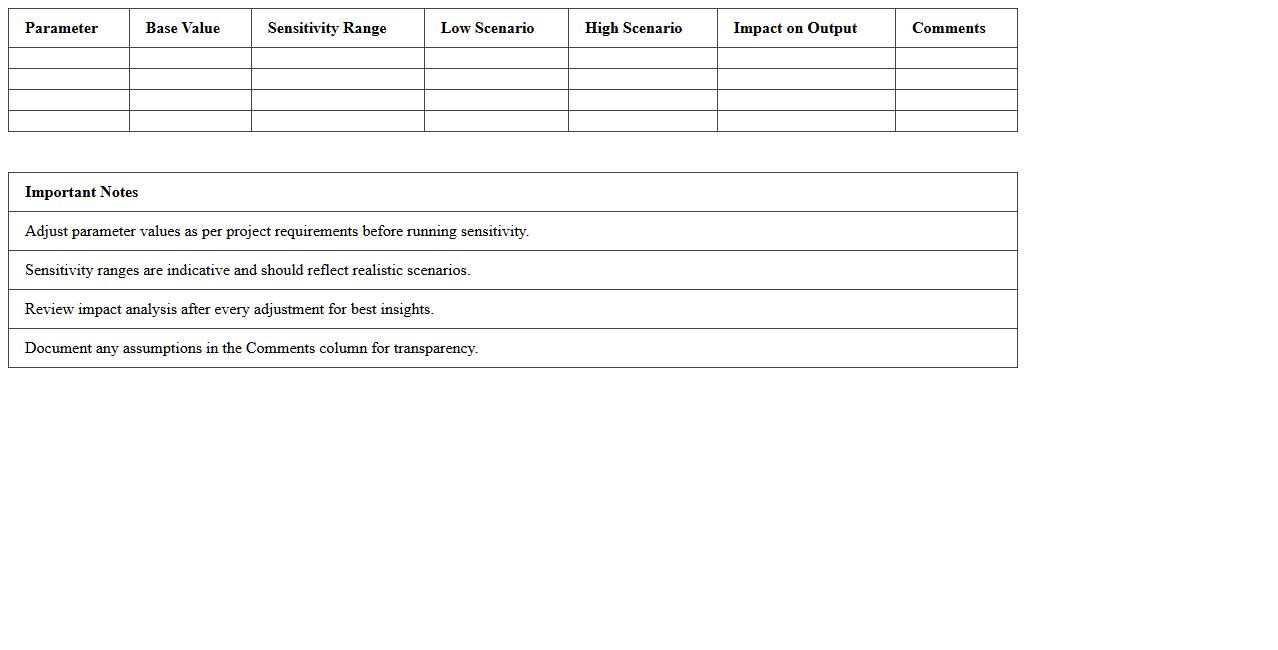
Investment Parameter Sensitivity Dashboard
The
Investment Parameter Sensitivity Dashboard document provides a detailed analysis of how variations in key investment parameters affect portfolio performance and risk metrics. It helps investors and analysts identify critical factors that drive returns and assess the robustness of investment strategies under different market scenarios. This tool enhances decision-making by enabling more informed adjustments to asset allocation and risk management practices.
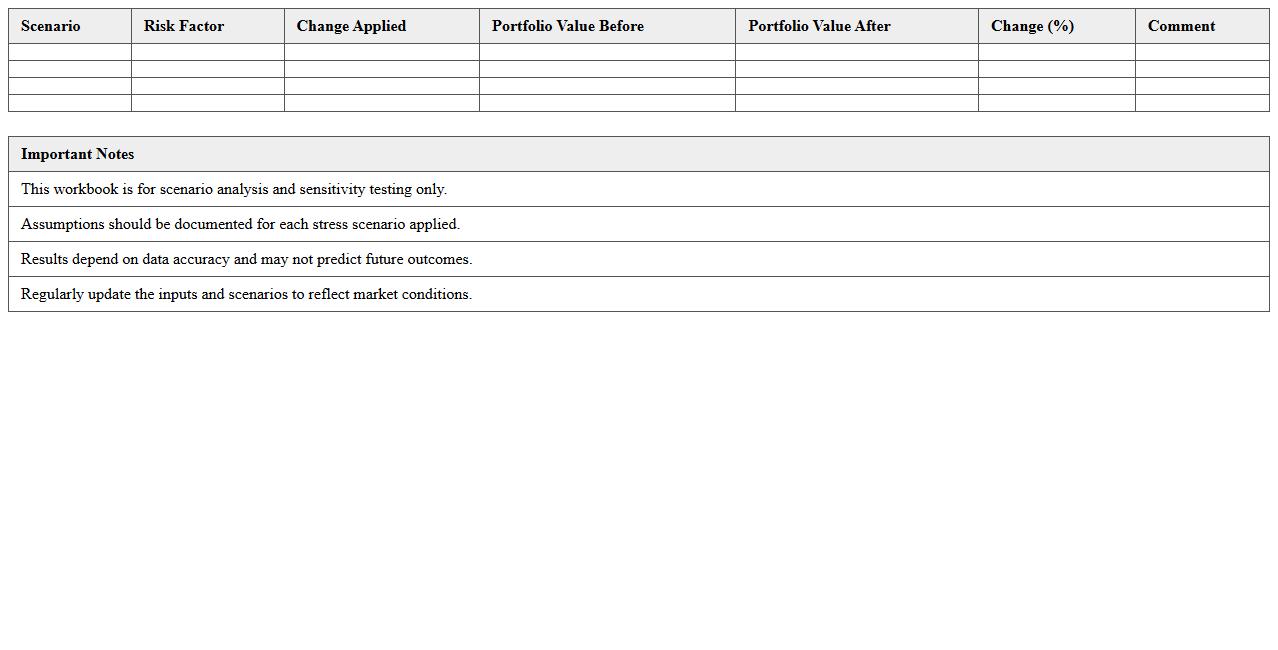
Portfolio Stress Test Sensitivity Workbook
The
Portfolio Stress Test Sensitivity Workbook document is a comprehensive tool designed to evaluate the impact of various risk factors on investment portfolios under different stress scenarios. It allows financial analysts to measure sensitivity to market fluctuations, interest rate changes, and credit events, providing critical insights into potential portfolio vulnerabilities. Utilizing this workbook enables proactive risk management and informed decision-making to enhance portfolio resilience.
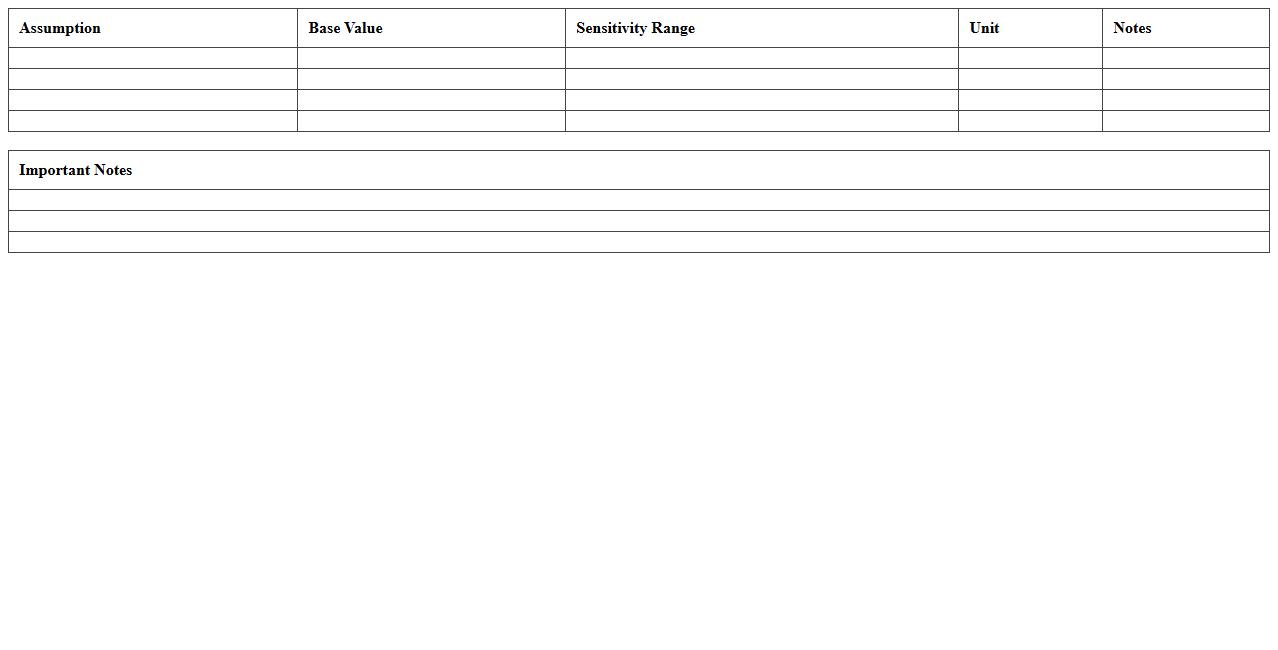
Financial Assumption Sensitivity Excel Planner
The
Financial Assumption Sensitivity Excel Planner is a dynamic tool designed to analyze how changes in key financial assumptions impact business outcomes. By adjusting variables such as revenue growth, cost of goods sold, and interest rates, users can model various financial scenarios and assess potential risks and opportunities. This planner enhances decision-making by providing clear insights into the sensitivity of financial projections, enabling more informed strategic planning and resource allocation.
How can I automate sensitivity analysis for asset allocation in Excel using VBA?
To automate sensitivity analysis for asset allocation in Excel, begin by recording or writing a VBA macro that changes asset weights systematically. Use loops to iterate through possible weight combinations and calculate portfolio metrics such as returns and risk. This approach enables dynamic updates and saves time compared to manual adjustments.
Which Excel functions best handle scenario simulations for portfolio risk factors?
Excel functions like RAND, NORM.INV, and DATA TABLE are ideal for scenario simulations involving portfolio risk factors. RAND generates random values, while NORM.INV helps simulate returns based on a normal distribution. Combining these functions allows you to model a variety of market scenarios realistically.
What is the process to link Monte Carlo sensitivity analysis with portfolio returns in Excel?
The process begins by creating a Monte Carlo simulation that generates multiple random scenarios for risk factors influencing portfolio returns. Using VBA or Excel formulas, calculate portfolio returns for each scenario and compile the results. Analyze these outcomes to assess how sensitive portfolio returns are to changes in underlying variables using statistical summaries.
How do I visualize sensitivity of individual asset weights on overall portfolio performance in Excel?
Visualize the sensitivity of asset weights by constructing a sensitivity table that varies weights systematically and records portfolio performance metrics. Use Excel charts--such as line graphs or heat maps--to display the impact of each asset's weight on overall returns and risk. Conditional formatting and data visualization tools enhance interpretability of the sensitivity results.
Can Excel's Data Table tool efficiently perform multi-variable sensitivity analysis for investment portfolios?
Excel's Data Table tool is highly efficient for conducting multi-variable sensitivity analysis in investment portfolios. It allows simultaneous variation of two or more input variables, helping determine combined effects on portfolio outcomes quickly. This tool is especially useful for comparing different allocation strategies under multiple market conditions.
More Analysis Excel Templates