The Inventory Analysis Excel Template for Retail Businesses streamlines stock tracking and management by providing customizable sheets for product categorization, stock levels, and reorder points. This template helps retailers optimize inventory turnover, minimize overstock, and identify slow-moving items through detailed reports and charts. Efficiently managing inventory data enhances decision-making and supports improved sales forecasting.
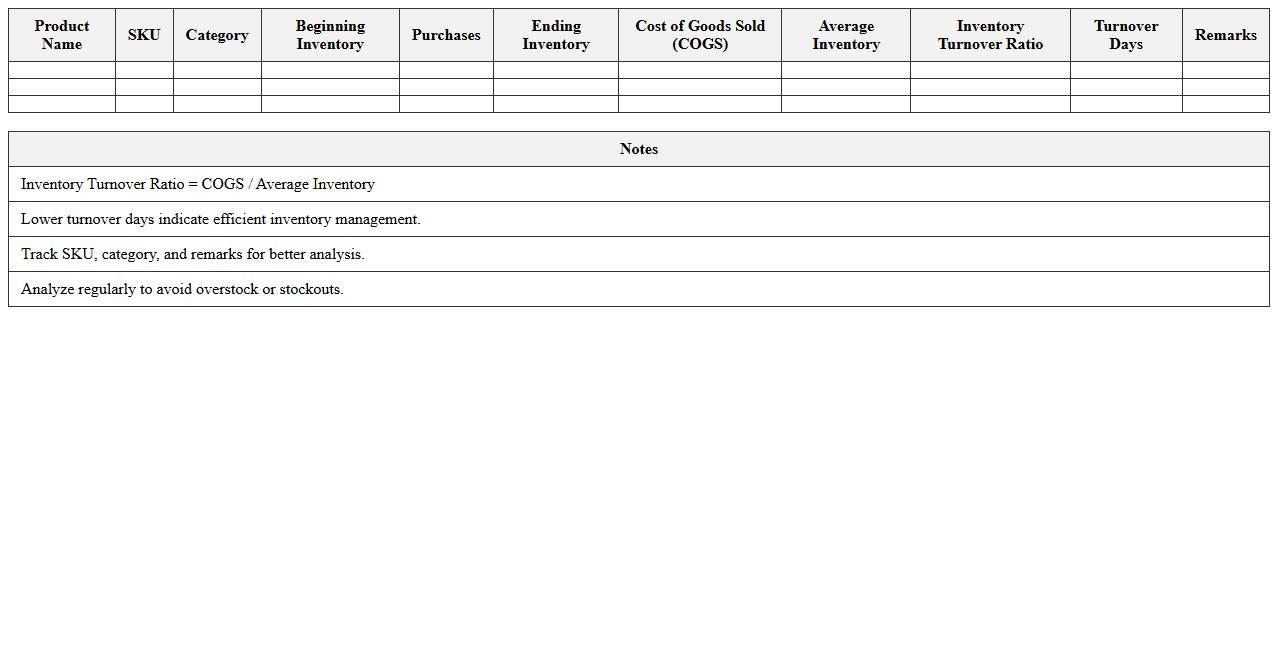
Inventory Turnover Analysis Excel Template for Retail Stores
Inventory Turnover Analysis Excel Template for Retail Stores is a powerful tool designed to track and evaluate the efficiency of inventory management by calculating how often stock is sold and replaced within a specific period. This template helps retail managers identify slow-moving products, optimize stock levels, and improve cash flow by providing clear insights into sales performance and inventory cycles. Using this
inventory turnover analysis enables better decision-making, reducing excess inventory costs and enhancing overall profitability.
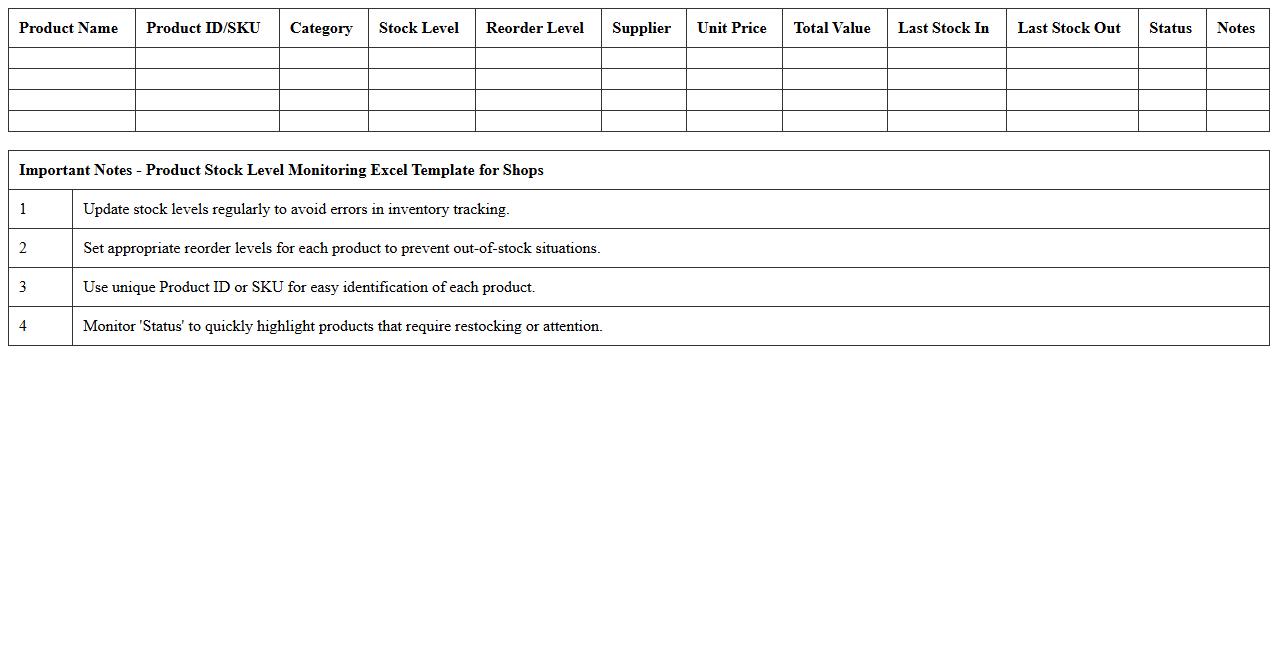
Product Stock Level Monitoring Excel Template for Shops
The
Product Stock Level Monitoring Excel Template for shops is a structured spreadsheet designed to track inventory quantities, sales, and restocking needs efficiently. It helps businesses maintain optimal stock levels, avoid overstocking or stockouts, and streamline inventory management by providing real-time visibility into product availability. This tool supports data-driven decisions, improves ordering accuracy, and enhances overall shop operational efficiency.
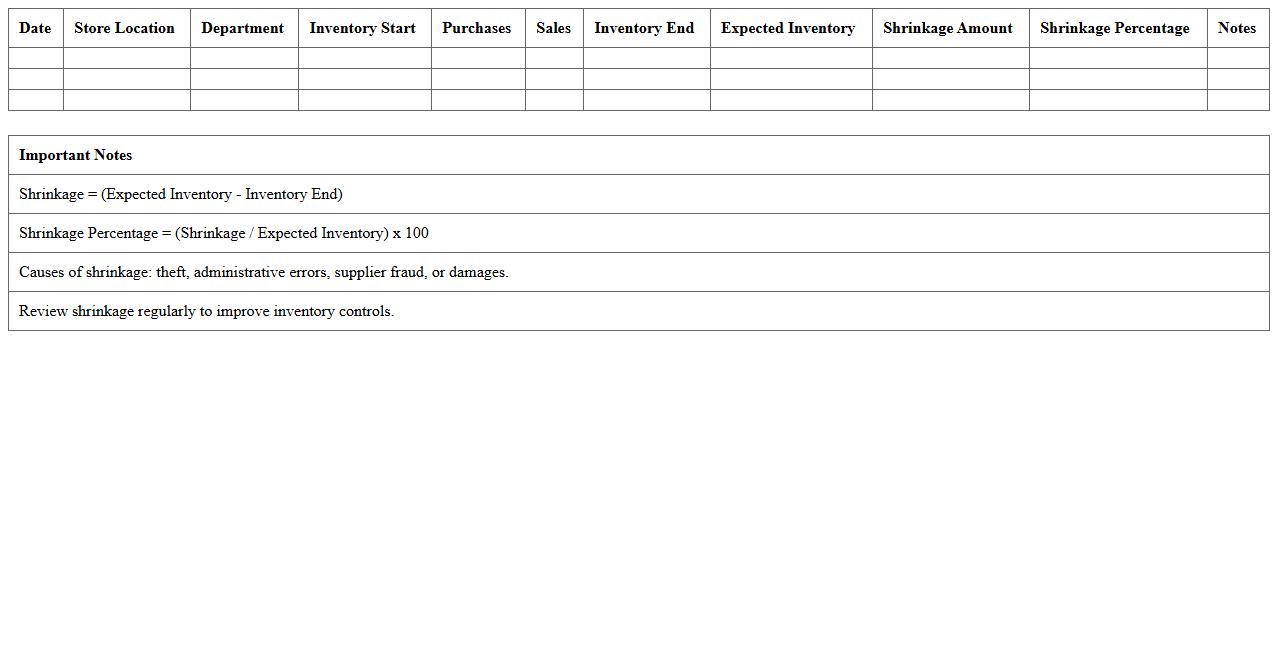
Retail Inventory Shrinkage Analysis Spreadsheet
A
Retail Inventory Shrinkage Analysis Spreadsheet is a detailed document designed to track and analyze inventory losses caused by theft, damage, or administrative errors. It helps retailers identify patterns, quantify shrinkage rates, and implement targeted strategies to reduce financial losses. By using this tool, businesses can improve inventory accuracy, enhance loss prevention efforts, and boost overall profitability.
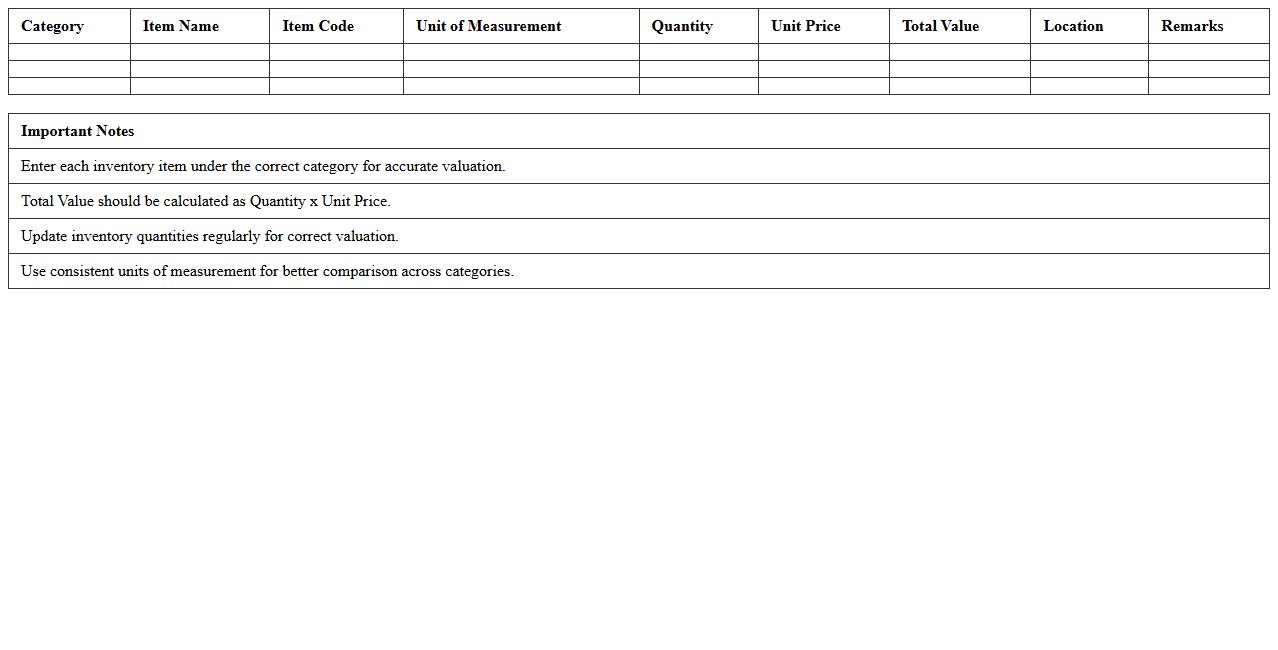
Category-Wise Inventory Valuation Excel Sheet
A
Category-Wise Inventory Valuation Excel Sheet is a detailed spreadsheet that organizes inventory data by distinct product categories, enabling accurate tracking of stock levels, costs, and overall value. This document helps businesses simplify inventory management by providing clear insights into category-specific valuations, which assists in making informed purchasing and sales decisions. By using this sheet, companies can optimize inventory turnover, reduce holding costs, and improve profitability through targeted analysis of category performance.
SKU-Level Inventory Movement Tracker Excel Template
The
SKU-Level Inventory Movement Tracker Excel Template is a detailed spreadsheet designed to monitor and record the flow of individual stock-keeping units (SKUs) within inventory systems. It enables businesses to track item quantities, movement dates, and transaction types, providing precise insights into stock levels and turnover rates. This tool helps optimize inventory management by reducing stockouts, minimizing excess inventory, and improving demand forecasting accuracy.
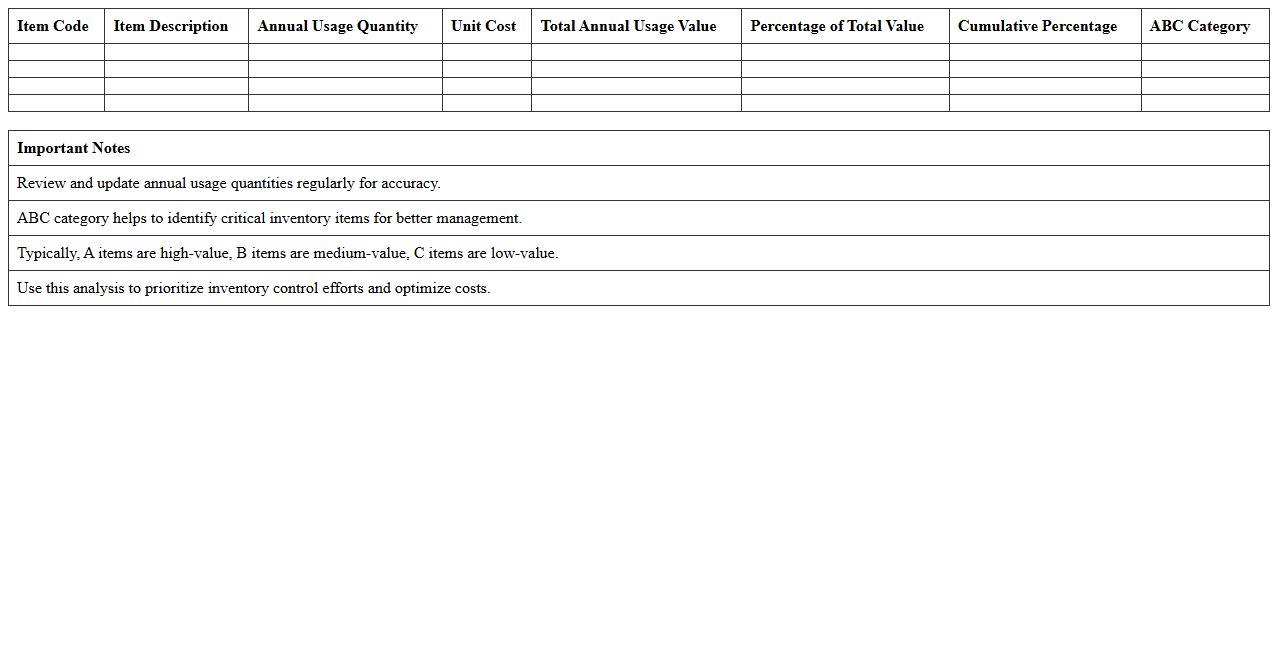
ABC Inventory Classification Analysis Excel Spreadsheet
The
ABC Inventory Classification Analysis Excel Spreadsheet is a tool designed to categorize inventory items based on their value and importance, typically dividing them into three groups: A, B, and C. It helps businesses prioritize management efforts by identifying high-value items (A), moderate-value items (B), and low-value items (C), enabling better stock control and optimized resource allocation. Using this spreadsheet enhances decision-making accuracy, reduces carrying costs, and improves inventory turnover rates.
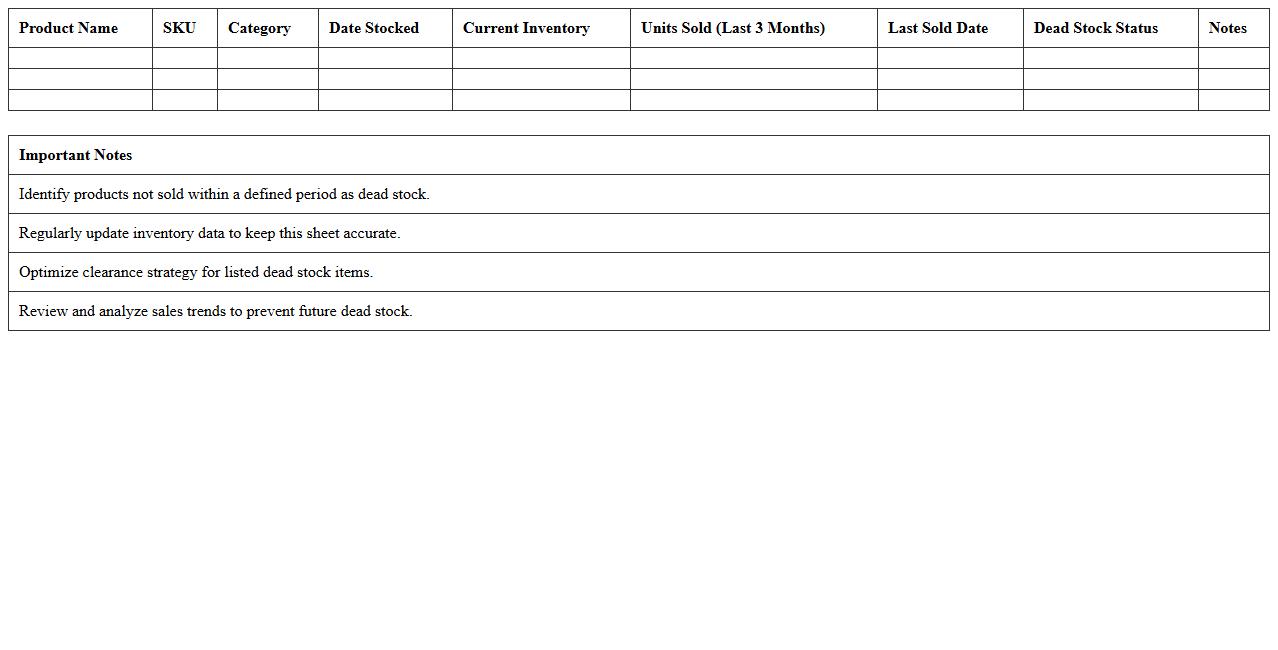
Dead Stock Identification Excel Template for Retail
The
Dead Stock Identification Excel Template for retail is a practical tool designed to systematically track and analyze inventory that remains unsold over an extended period. By highlighting stagnant products, the template enables retailers to make informed decisions on discount strategies, clearance sales, or discontinuation to optimize inventory turnover and improve cash flow. Utilizing this document helps reduce storage costs and enhances overall retail efficiency by focusing on actionable data-driven inventory management.
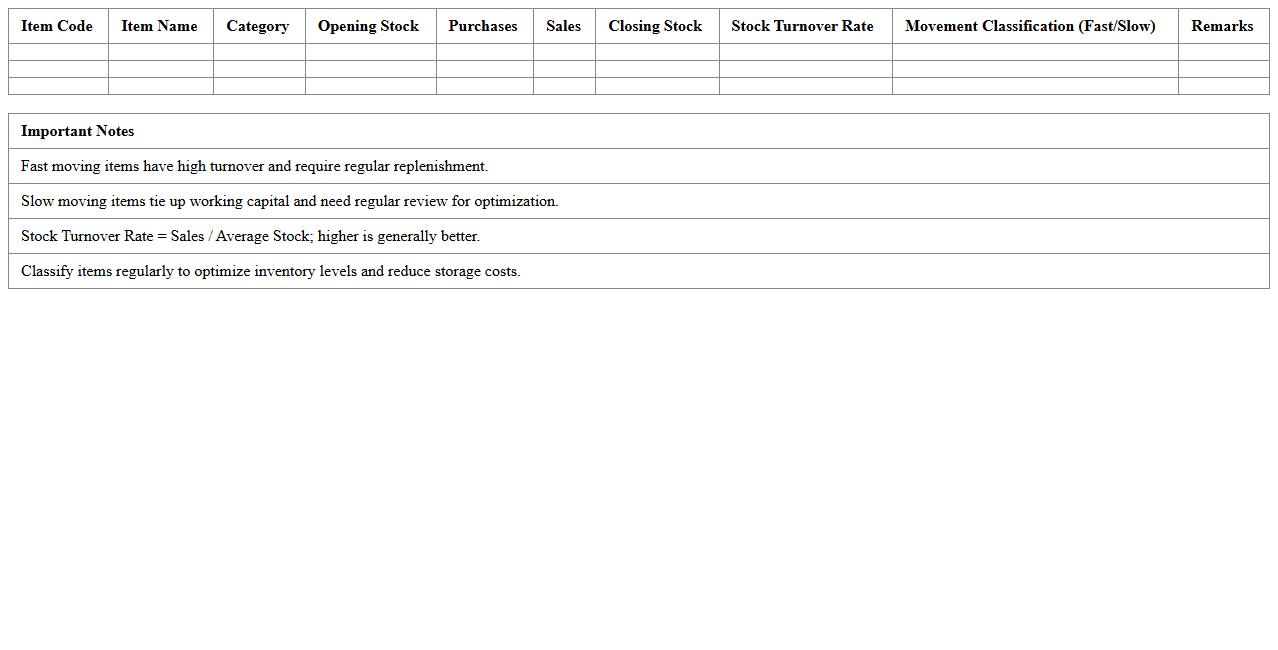
Fast and Slow Moving Inventory Analysis Excel Sheet
A
Fast and Slow Moving Inventory Analysis Excel Sheet is a powerful tool designed to categorize inventory items based on their turnover rates, enabling businesses to identify which products sell quickly and which remain stagnant. This analysis helps optimize inventory management by reducing holding costs, avoiding stockouts, and improving cash flow. Utilizing this document allows companies to make informed decisions about purchasing, storage, and sales strategies, ultimately enhancing operational efficiency.
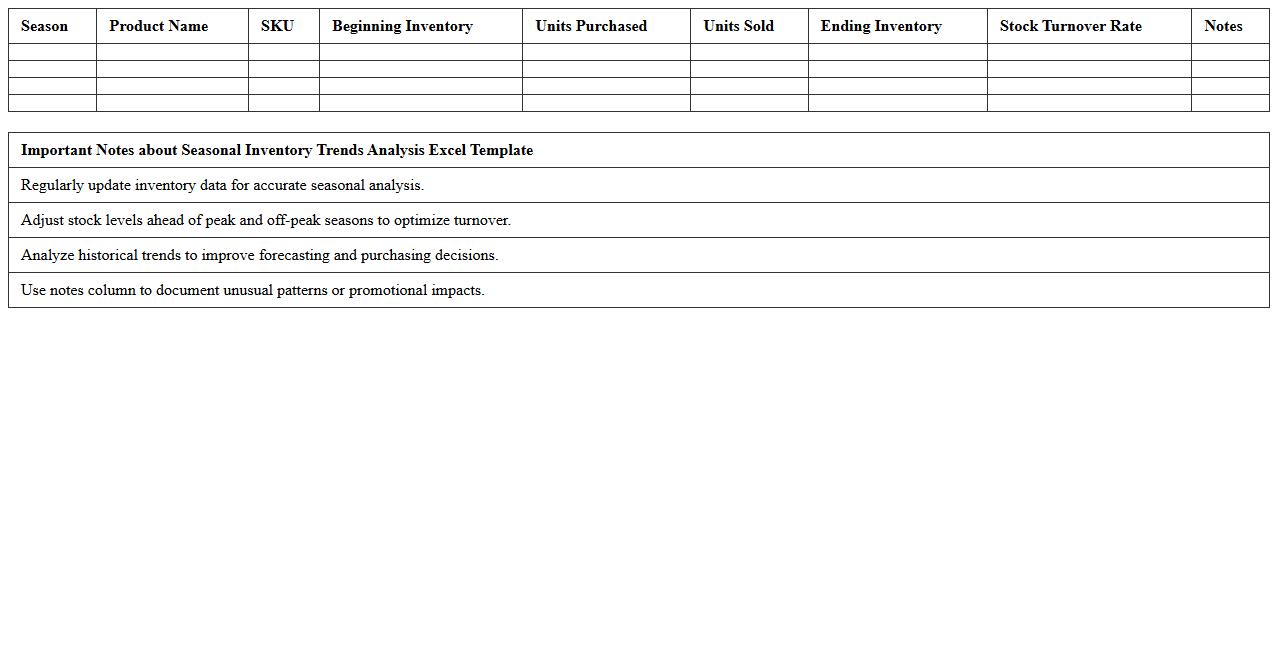
Seasonal Inventory Trends Analysis Excel Template
The
Seasonal Inventory Trends Analysis Excel Template document is a powerful tool designed to track and analyze fluctuations in inventory levels relative to seasonal demand patterns. It helps businesses identify peak periods and optimize stock management by providing visual insights through charts and pivot tables. This template enhances decision-making, reduces holding costs, and improves overall inventory turnover efficiency.
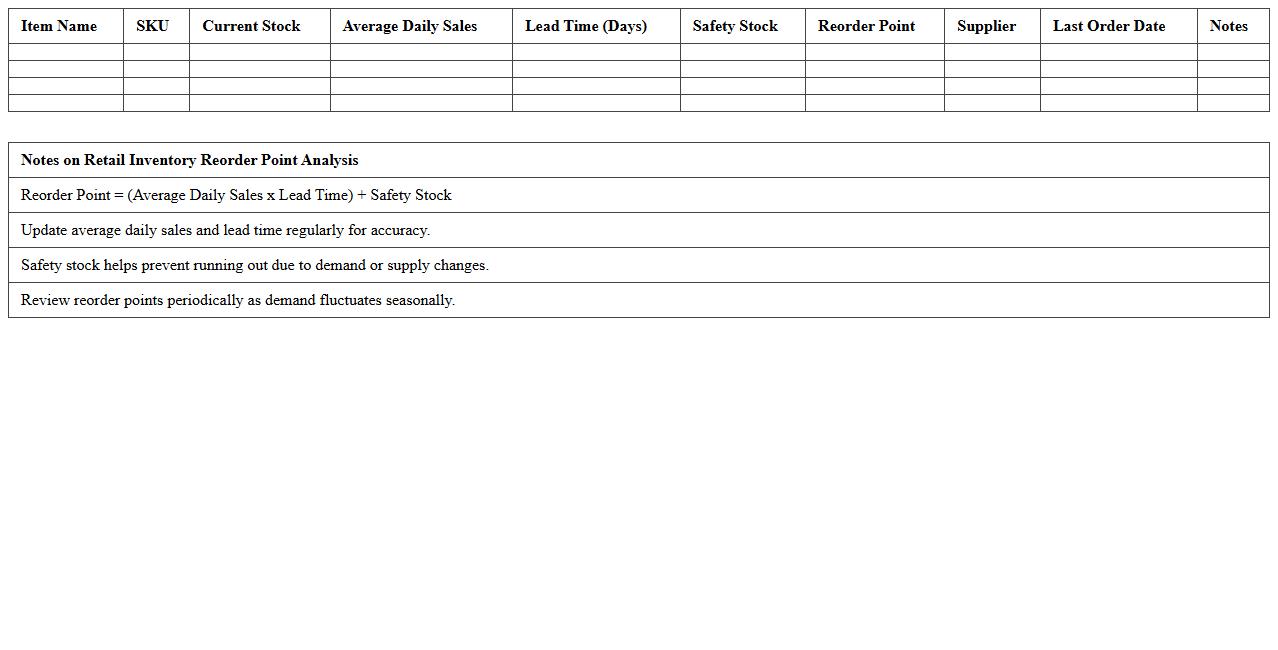
Retail Inventory Reorder Point Analysis Excel Spreadsheet
The
Retail Inventory Reorder Point Analysis Excel Spreadsheet is a powerful tool designed to track stock levels and determine the optimal reorder points for various retail products. By analyzing historical sales data, lead times, and safety stock requirements, this spreadsheet helps prevent stockouts and overstock situations, ensuring efficient inventory management. Utilizing this document enables retailers to maintain product availability, reduce carrying costs, and improve overall supply chain efficiency.
How can conditional formatting highlight low-stock items in an Inventory Analysis Excel sheet?
Conditional formatting is a powerful tool to highlight low-stock items in an inventory sheet by automatically changing cell colors based on stock levels. You can set rules to format cells red when inventory falls below a specific threshold, drawing attention to critical shortages. This helps managers quickly identify items that need replenishment without manually scanning the data.
What formulas track stock turnover rates for specific retail products?
Stock turnover rate can be tracked using formulas that calculate the ratio of cost of goods sold to average inventory for each product. For example, the formula =COGS/Average Inventory shows how often stock is sold and replaced during a period. This helps retailers optimize inventory levels and improve product management.
Which pivot table setup best isolates slow-moving inventory in retail analysis?
Creating a pivot table that rows include product names and columns summarize sales volume allows clear identification of slow-moving inventory. By filtering or sorting based on low sales or long inventory aging, analysts isolate underperforming SKUs. Incorporating inventory quantity and turnover rate into the pivot table enhances retail inventory optimization.
How is inventory shrinkage calculated and displayed in Excel dashboards?
Inventory shrinkage is calculated by subtracting the physical stock count from the recorded book inventory, then dividing by the book inventory to get a shrinkage percentage. Excel dashboards use conditional charts or gauges to visually present shrinkage trends over time. This metric is vital for highlighting losses due to theft, damage, or errors.
What data validation rules prevent duplicate SKU entries in inventory spreadsheets?
To prevent duplicate SKU entries, Excel can use data validation with a custom formula like =COUNTIF(A:A,A1)=1, which restricts entries appearing more than once. This rule enforces unique SKU values ensuring inventory accuracy and avoiding data conflicts. Maintaining unique SKUs is crucial for reliable inventory tracking and analysis.
More Analysis Excel Templates