Break-Even Analysis Excel Template for Startups simplifies financial planning by calculating the point where total revenues equal total costs, ensuring no net loss or gain. This template helps startups forecast profitability, manage expenses, and set realistic sales targets using customizable fields. Entrepreneurs can easily visualize fixed and variable costs alongside revenue projections to make informed business decisions.
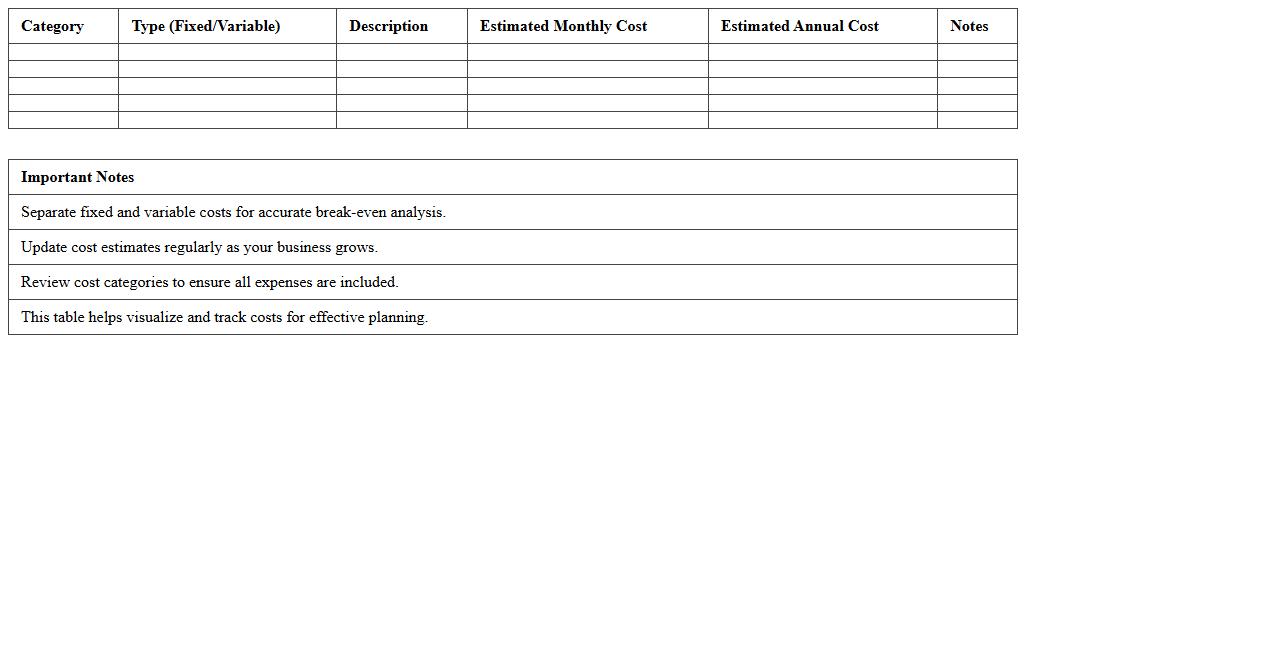
Startup Fixed and Variable Costs Break-Even Analyzer Template
The
Startup Fixed and Variable Costs Break-Even Analyzer Template is a financial tool designed to help entrepreneurs calculate the exact point where total revenues cover both fixed and variable expenses. By inputting detailed cost data, this template facilitates precise break-even analysis, enabling startups to make informed decisions about pricing, budgeting, and profitability timelines. It is useful for identifying critical cost structures and assessing financial viability before launching or scaling a business.
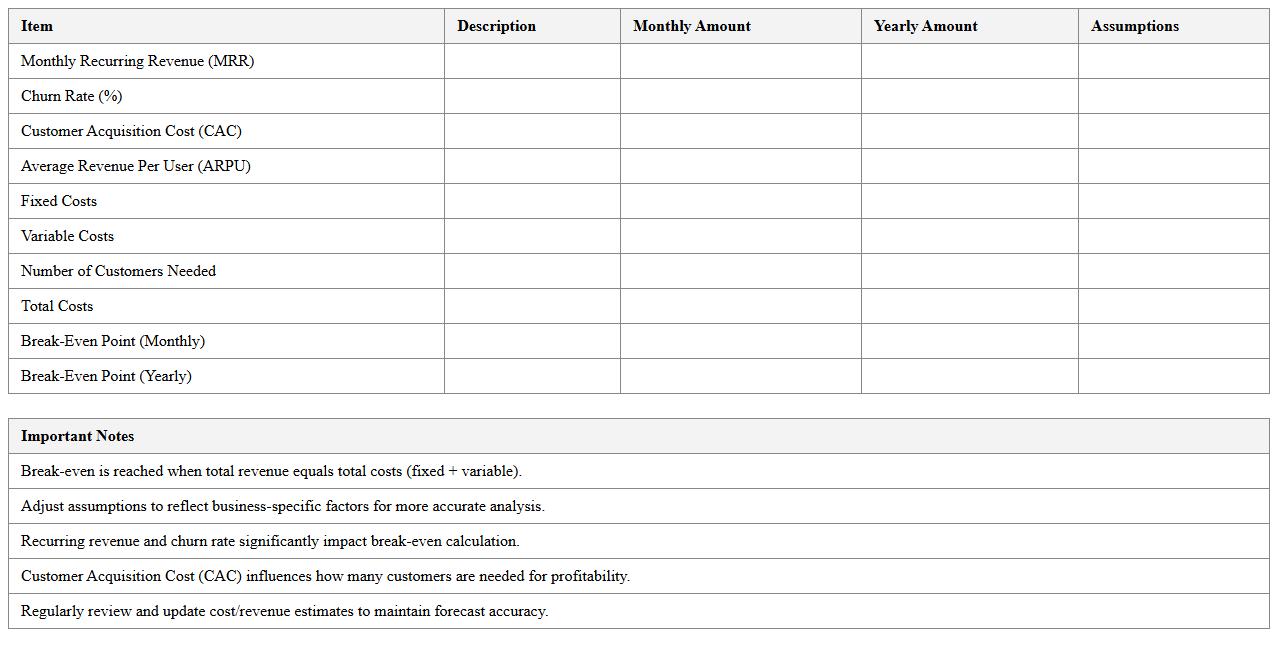
SaaS Business Break-Even Point Calculation Excel Sheet
The
SaaS Business Break-Even Point Calculation Excel Sheet is a vital financial tool designed to determine when a Software as a Service (SaaS) business will become profitable by comparing fixed costs, variable costs, and revenue. This document helps entrepreneurs and managers identify the exact sales volume or subscription numbers needed to cover all expenses, enabling effective budgeting and strategic planning. Utilizing this sheet allows for data-driven decisions that minimize financial risks and optimize growth opportunities in competitive markets.
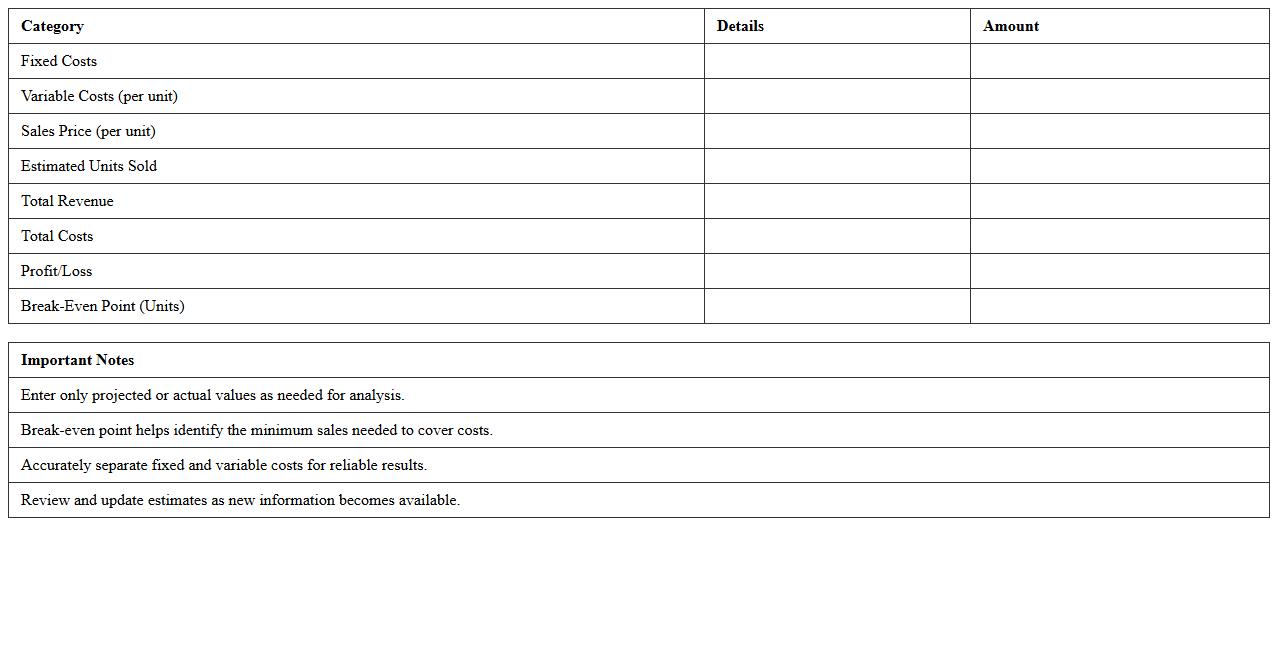
Product Launch Break-Even Analysis Spreadsheet Template
A
Product Launch Break-Even Analysis Spreadsheet Template is a tool designed to calculate the exact point at which your product's revenue covers all its costs, helping you understand when the product will become profitable. This template allows you to input fixed costs, variable costs, and pricing details to visualize break-even points through graphs and detailed data summaries. By using this spreadsheet, businesses can make informed decisions about pricing strategies, cost control, and sales targets to ensure a successful product launch.
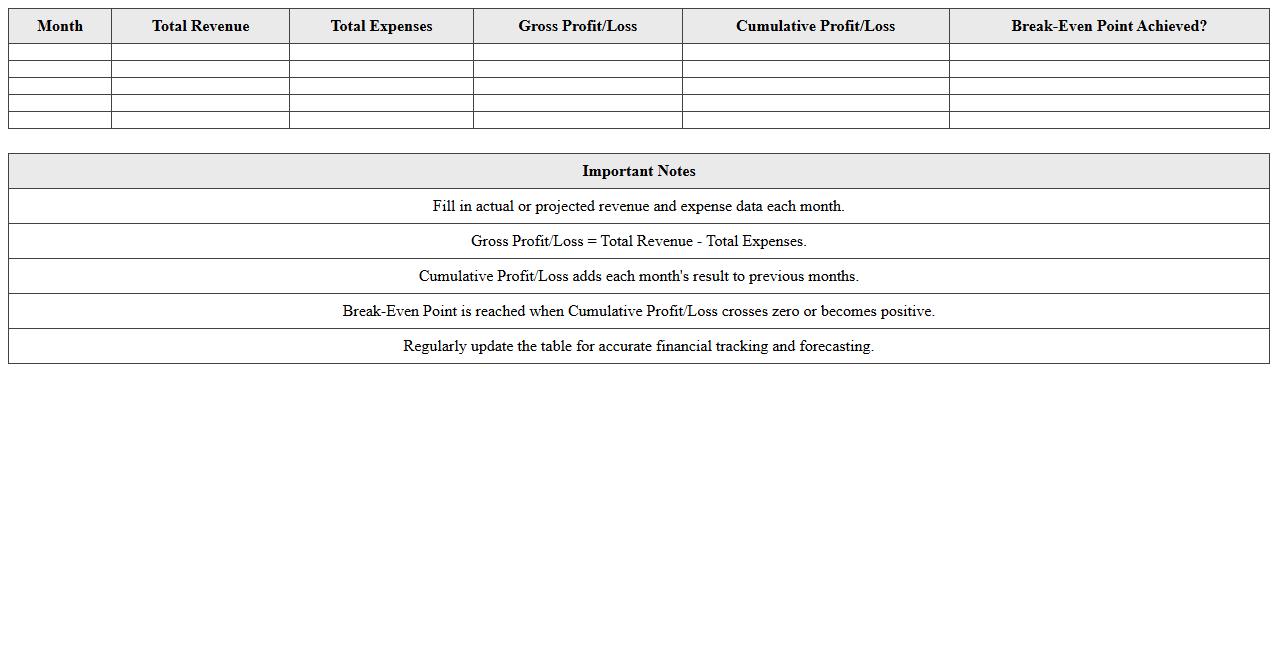
Startup Revenue and Expense Break-Even Dashboard
The
Startup Revenue and Expense Break-Even Dashboard document provides a clear visualization of when a startup's total revenue equals its total expenses, indicating the break-even point. It is essential for tracking financial health, enabling entrepreneurs to identify the minimum sales needed to avoid losses. This dashboard helps optimize budgeting, improve cash flow management, and make informed decisions for sustainable growth.
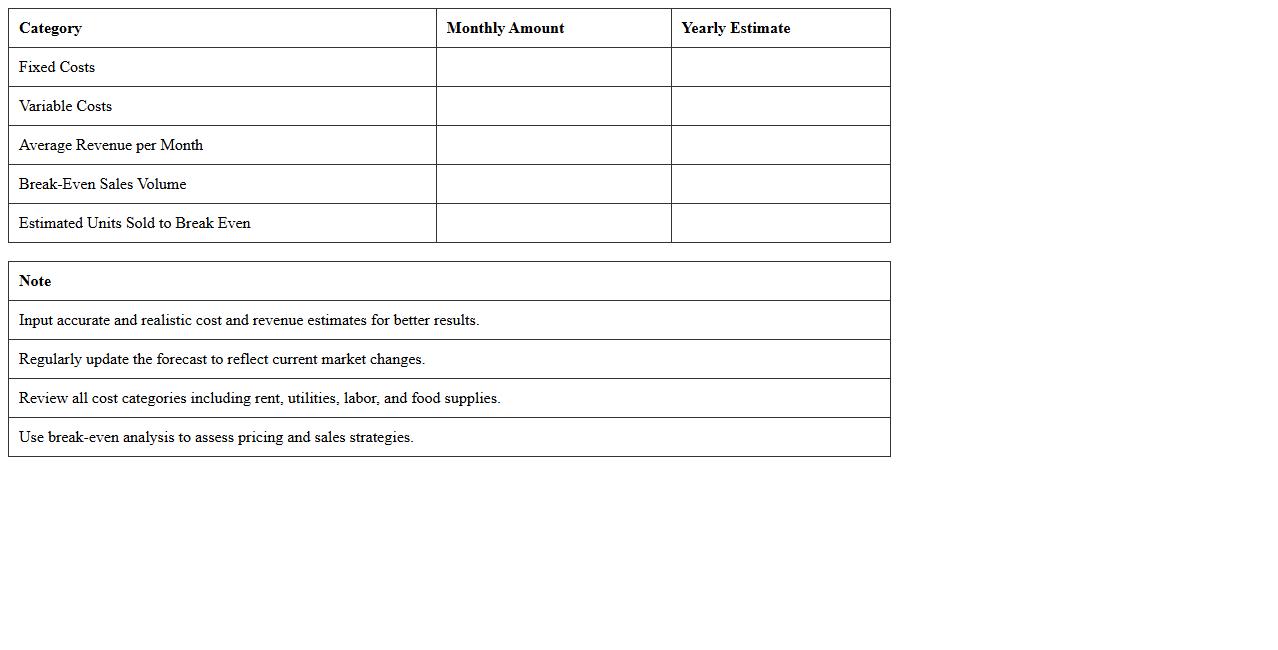
Restaurant Startup Break-Even Forecast Excel Template
The
Restaurant Startup Break-Even Forecast Excel Template is a financial planning tool designed to help new restaurant owners calculate when their business will become profitable by comparing fixed and variable costs against projected revenues. This template allows users to input key financial data such as startup expenses, monthly operating costs, and expected sales, providing a clear visualization of the break-even point. By using this forecast, entrepreneurs can make informed decisions on pricing, cost control, and sales targets to ensure sustainable business growth.
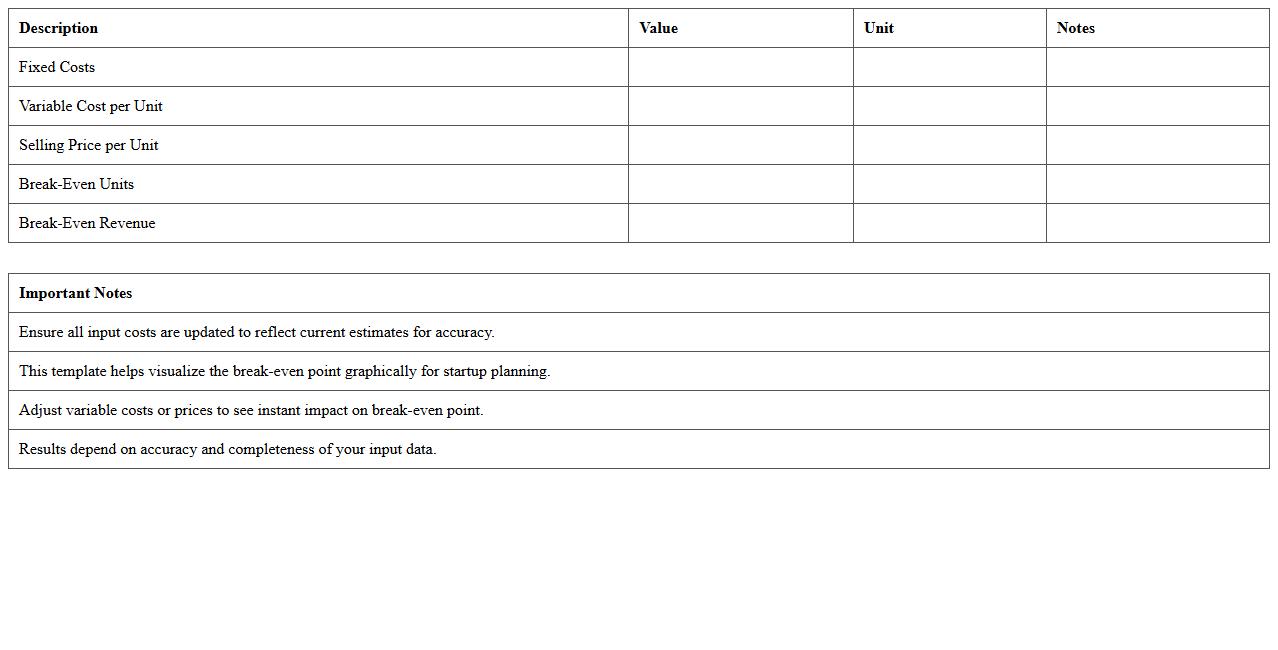
Break-Even Point Graph Generator Excel for Startups
The
Break-Even Point Graph Generator Excel for startups is a dynamic tool designed to visually represent the break-even analysis by calculating the point where total costs equal total revenue. This document allows entrepreneurs to input variables such as fixed costs, variable costs, and sales price, generating a clear graphical representation that aids in financial decision-making. By using this tool, startups can identify the minimum sales needed to avoid losses, optimize pricing strategies, and plan resource allocation effectively for sustainable growth.
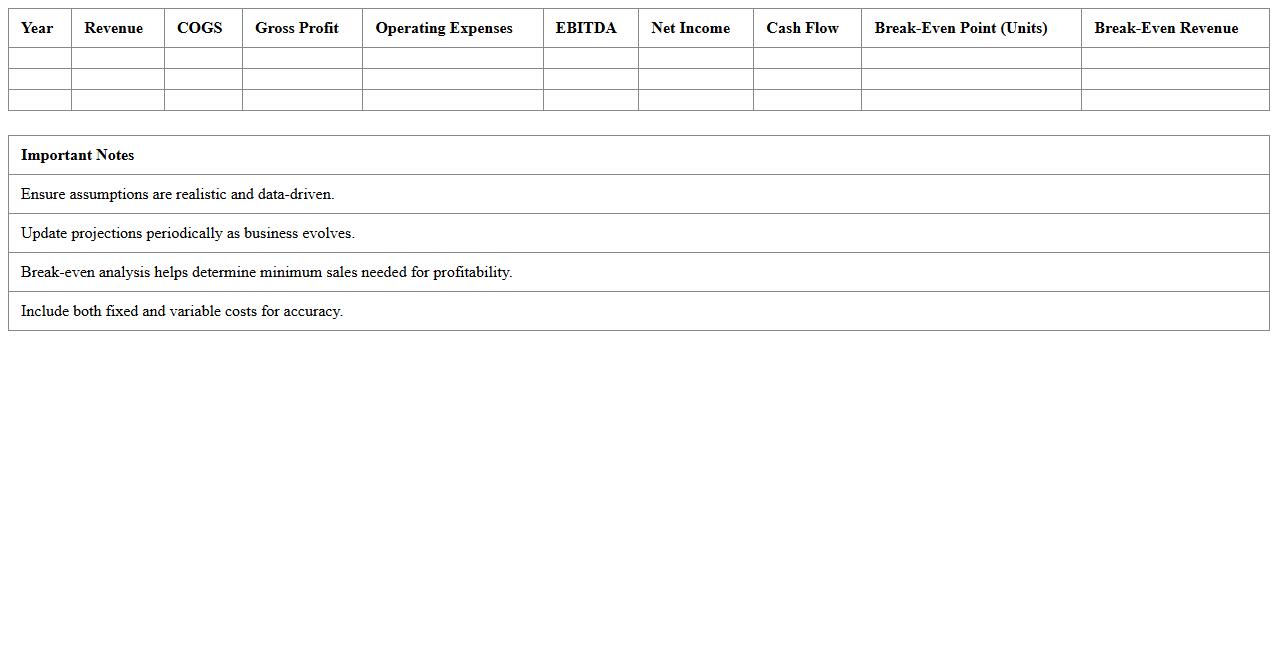
Startup Financial Projections & Break-Even Excel Model
A
Startup Financial Projections & Break-Even Excel Model document provides a detailed forecast of your business's financial performance, including revenue, expenses, and profitability over time. It helps entrepreneurs identify the break-even point where total costs equal total revenue, guiding effective budgeting and cash flow management. Utilizing this model enables informed decision-making, risk assessment, and strategic planning to increase the likelihood of startup success.
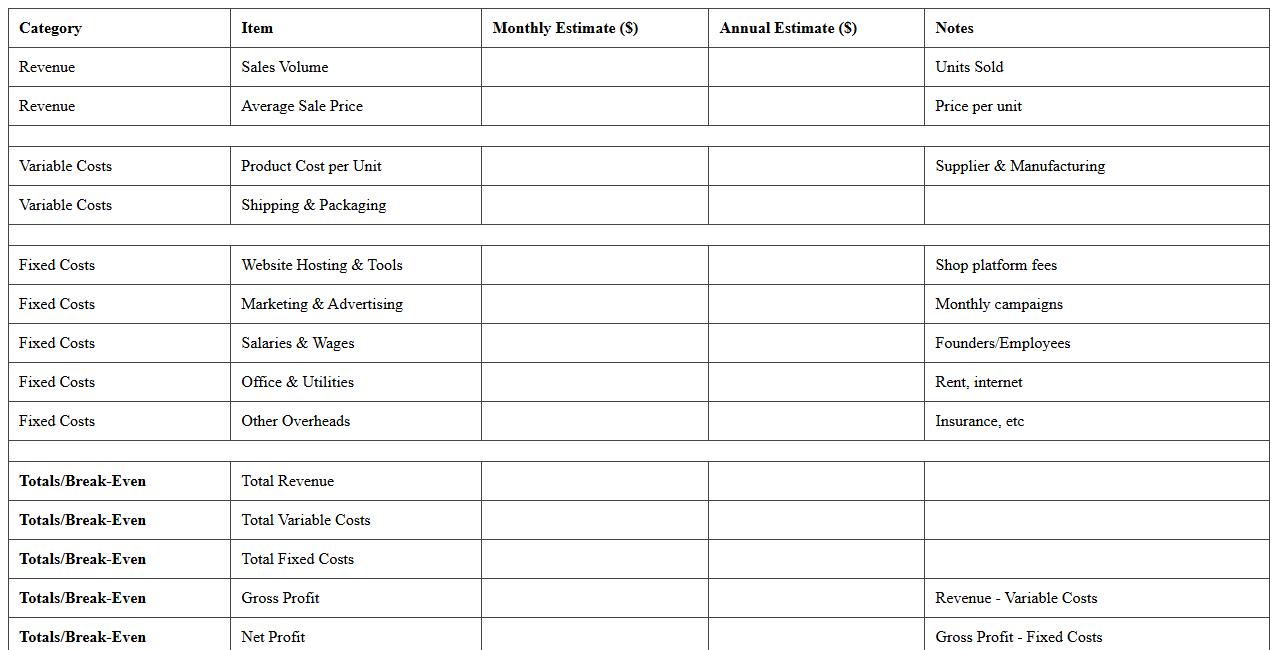
E-commerce Startup Break-Even Analysis Spreadsheet
The
E-commerce Startup Break-Even Analysis Spreadsheet is a financial tool designed to calculate the point at which total revenues equal total costs, indicating no profit or loss. This document helps entrepreneurs identify the minimum sales needed to cover expenses, enabling better cash flow management and informed pricing strategies. By providing clear visibility on fixed and variable costs, it supports strategic decision-making and risk reduction during the critical startup phase.
Tech Startup Break-Even Sensitivity Analysis Template
The
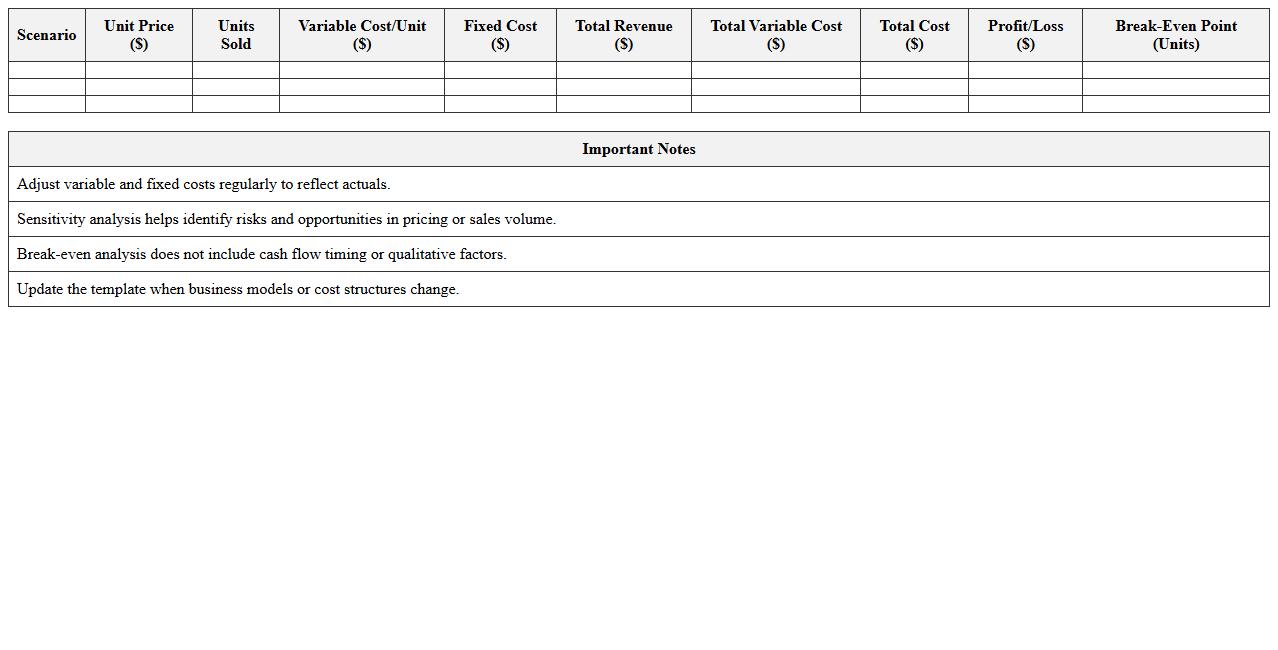
Tech Startup Break-Even Sensitivity Analysis Template document is a financial tool that helps entrepreneurs identify how changes in key variables like costs, pricing, and sales volume affect the break-even point of their startup. It enables founders to model different scenarios, assess risk, and make data-driven decisions to optimize profitability. This template is essential for understanding financial thresholds and improving strategic planning in a tech startup environment.
Simple Break-Even Analysis Template for Startup Founders
A
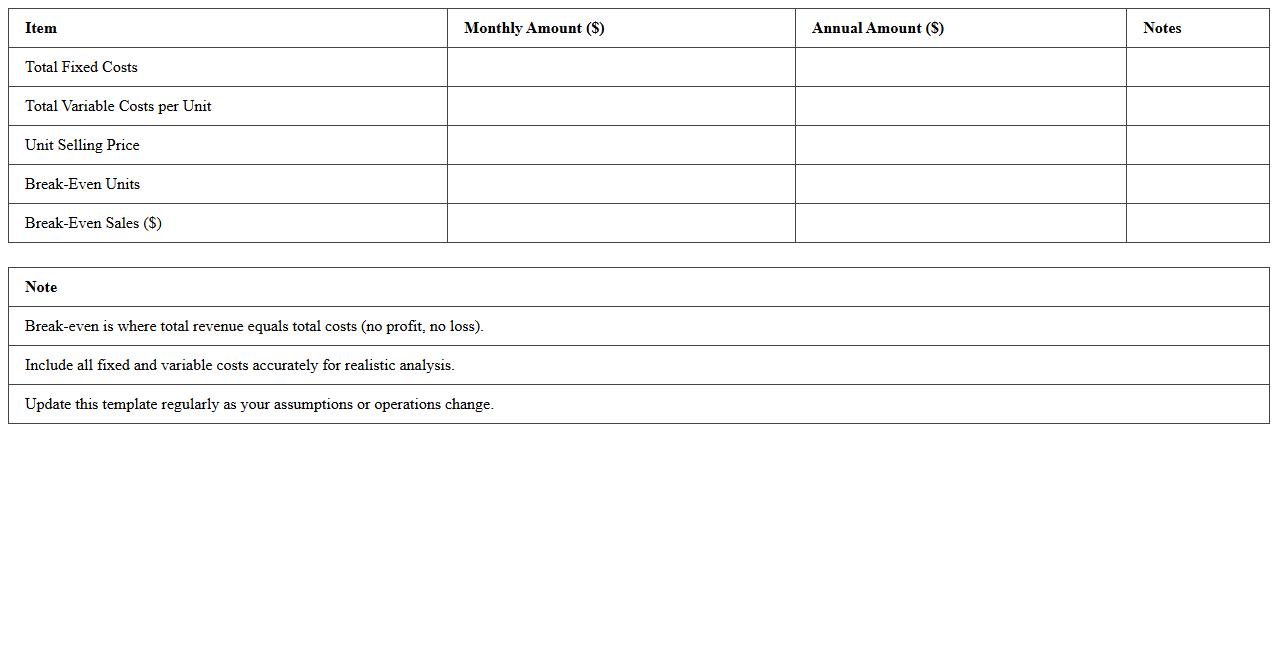
Simple Break-Even Analysis Template for Startup Founders is a financial tool designed to calculate the point at which total revenues equal total costs, helping to identify when a startup will become profitable. This document simplifies complex financial data, allowing founders to make informed decisions regarding pricing, cost control, and sales targets. By clearly illustrating break-even points, it supports strategic planning and risk assessment essential for sustainable business growth.
How does the "Break-Even Analysis Excel" template calculate fixed vs. variable costs for SaaS startups?
The Break-Even Analysis Excel template distinguishes between fixed and variable costs by allowing users to input categorized expenses. Fixed costs remain constant regardless of sales volume, such as rent or salaries, while variable costs fluctuate with usage or sales. This separation helps SaaS startups accurately assess their cost structure and improve financial forecasting.
Can the spreadsheet model handle multi-product break-even scenarios for e-commerce startups?
Yes, the template supports multi-product break-even analysis by enabling users to input costs and revenues for multiple products separately. It aggregates data to provide a comprehensive overview of the overall profitability across product lines. This flexibility is essential for e-commerce startups managing diverse inventory and sales channels.
Does the Excel provide visual breakeven charts or only numerical outputs?
The Excel template includes visual break-even charts that graphically represent the relationship between costs, sales, and profits. These charts enhance understanding by illustrating the break-even point clearly. In addition to visuals, numerical summaries provide detailed financial insights for better decision-making.
Is there an input for recurring revenue streams in the template?
The template allows users to input recurring revenue streams, which is critical for subscription-based SaaS businesses. It factors these steady income sources into the overall break-even calculation, reflecting realistic cash flow scenarios. This feature ensures startups can model sustainable revenue patterns accurately.
How customizable are the cost assumptions in the break-even Excel for different startup industries?
The cost assumptions in the break-even Excel are highly customizable, allowing users to tailor inputs based on industry-specific factors. Startups can adjust fixed and variable costs, pricing, and revenue inputs to match their unique financial environment. This adaptability makes the template suitable across various industries and business models.
More Analysis Excel Templates