The Product Usability Assessment Excel Template for UX Designers offers a structured and efficient way to evaluate user experience metrics and usability factors. It allows designers to systematically record, analyze, and visualize usability testing results, enhancing decision-making during product development. This template streamlines the assessment process by providing customizable fields tailored for comprehensive UX evaluation.
Product Usability Heuristic Evaluation Excel Template
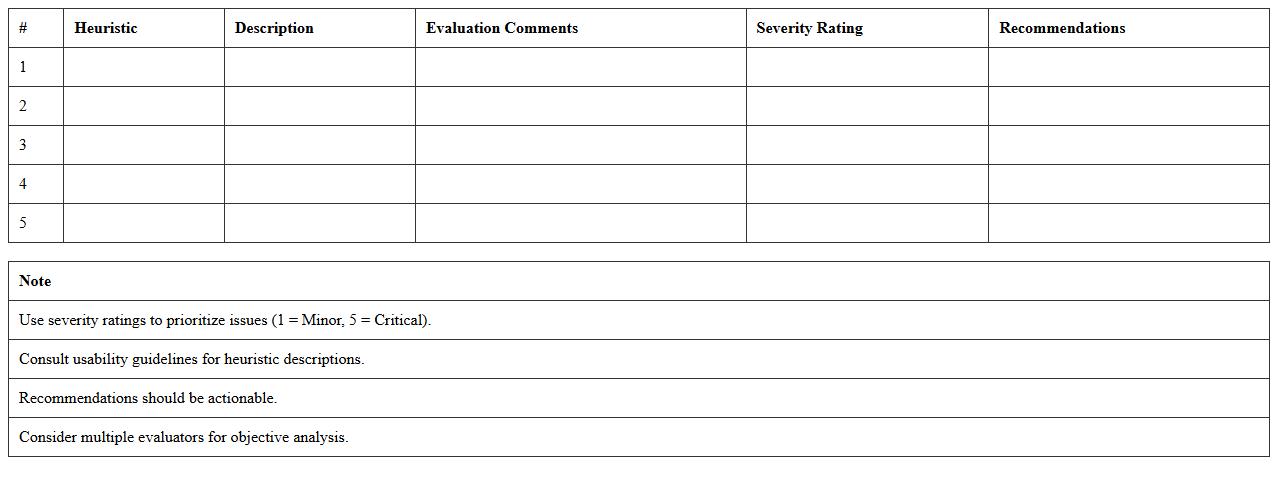
The
Product Usability Heuristic Evaluation Excel Template is a structured tool designed to systematically assess a product's user interface based on established usability heuristics. It enables teams to document, prioritize, and track usability issues efficiently, promoting better user experience outcomes. By using this template, organizations can streamline the evaluation process, ensure comprehensive coverage of usability principles, and facilitate clearer communication among stakeholders.
UX Task Analysis Assessment Excel Sheet
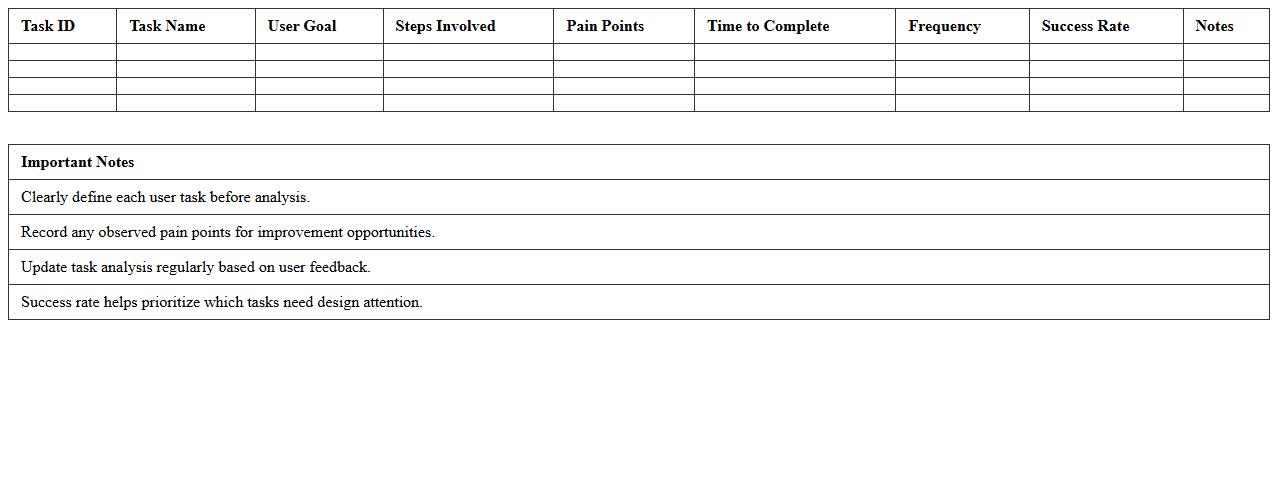
The
UX Task Analysis Assessment Excel Sheet document is a structured tool designed to evaluate and break down user tasks into specific, measurable components. It helps identify pain points, task efficiency, and user interaction patterns, enabling UX designers to optimize workflows and improve overall user experience. By systematically capturing data on task completion times, errors, and user feedback, this excel sheet supports informed decision-making in the design process.
Usability Testing Metrics Dashboard for Product Design
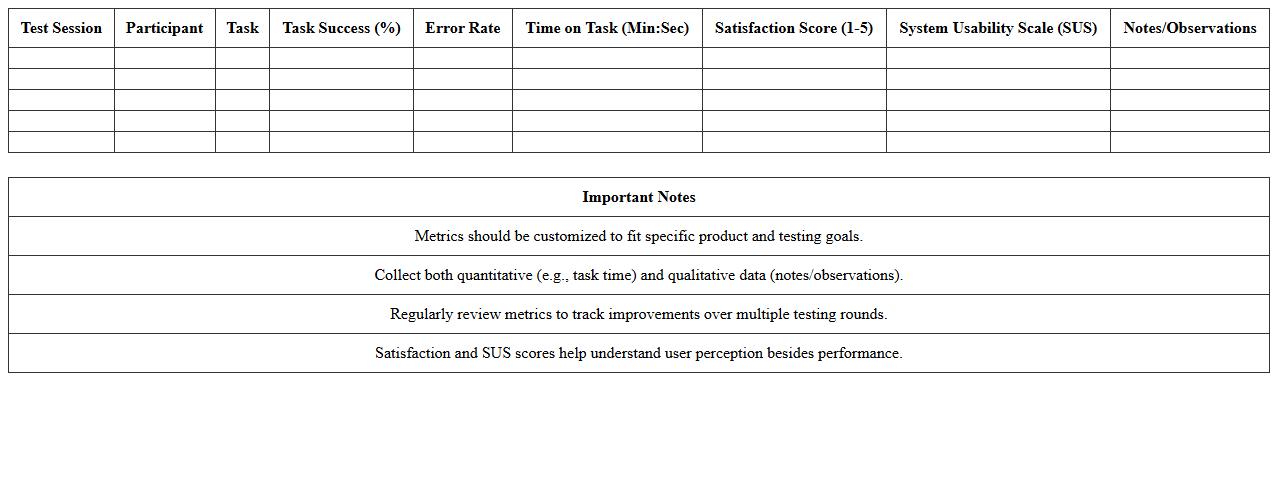
A
Usability Testing Metrics Dashboard for Product Design is a centralized tool that collects and visualizes key performance indicators such as task success rates, error frequency, and user satisfaction scores during usability testing sessions. It enables design teams to track user experience issues in real-time, prioritize improvements based on quantitative data, and measure the impact of design changes over iterative testing cycles. This dashboard facilitates informed decision-making, ensuring that product designs are optimized for intuitive use and overall effectiveness.
User Personas & Journey Mapping Excel Template
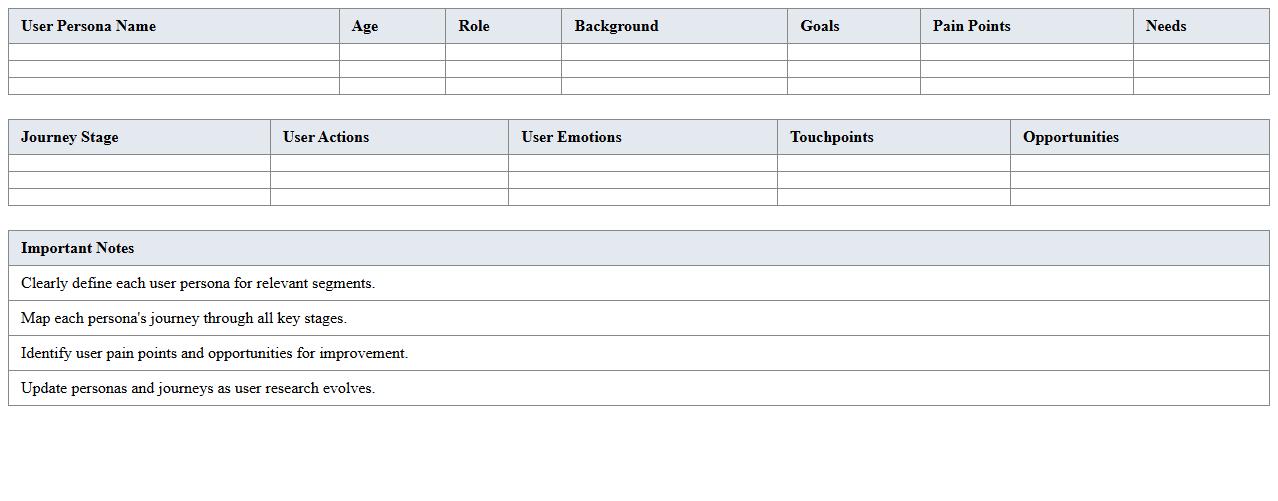
The
User Personas & Journey Mapping Excel Template is a structured document designed to create detailed profiles of target users and visualize their interactions with a product or service over time. This template helps teams identify user needs, pain points, and behaviors by organizing data into personas and mapping their customer journeys effectively. Utilizing this tool enhances decision-making, improves user experience, and aligns design strategies with real user insights.
Product Usability Issue Tracking Log
A
Product Usability Issue Tracking Log document systematically records and monitors usability problems encountered during product testing or user feedback sessions. It helps teams identify recurring issues, prioritize improvements, and ensure a user-centric design process. Maintaining this log enhances communication among designers, developers, and stakeholders, leading to more efficient resolution of usability challenges and improved product quality.
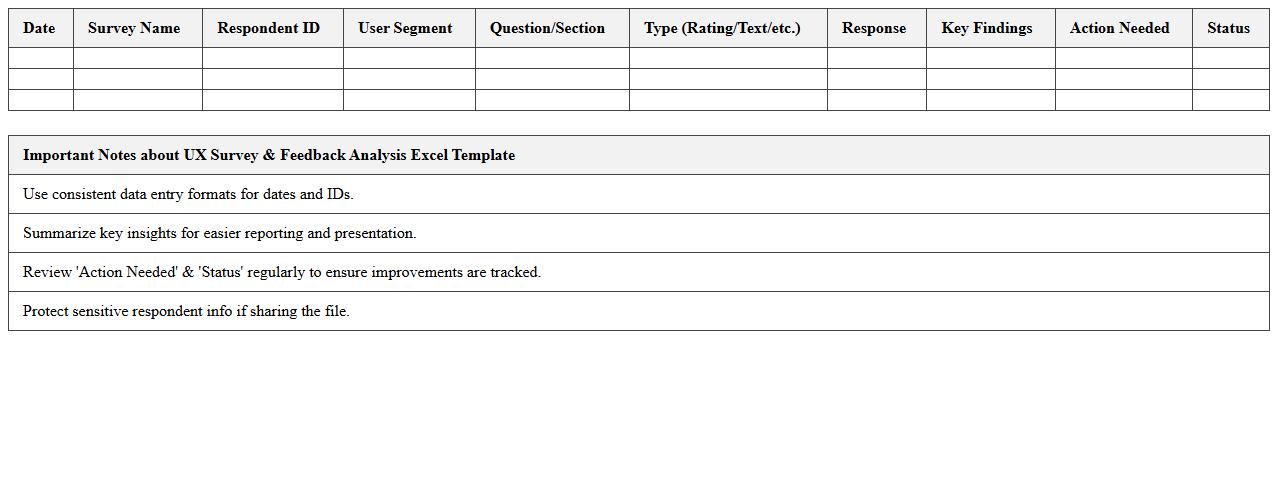
UX Survey & Feedback Analysis Excel Template
The
UX Survey & Feedback Analysis Excel Template is a comprehensive tool designed to organize, analyze, and visualize user experience survey data efficiently. It enables businesses to identify key pain points, track user satisfaction metrics, and generate actionable insights through integrated charts and summary statistics. This template streamlines decision-making processes by converting raw feedback into clear, data-driven strategies for improving product usability and customer engagement.
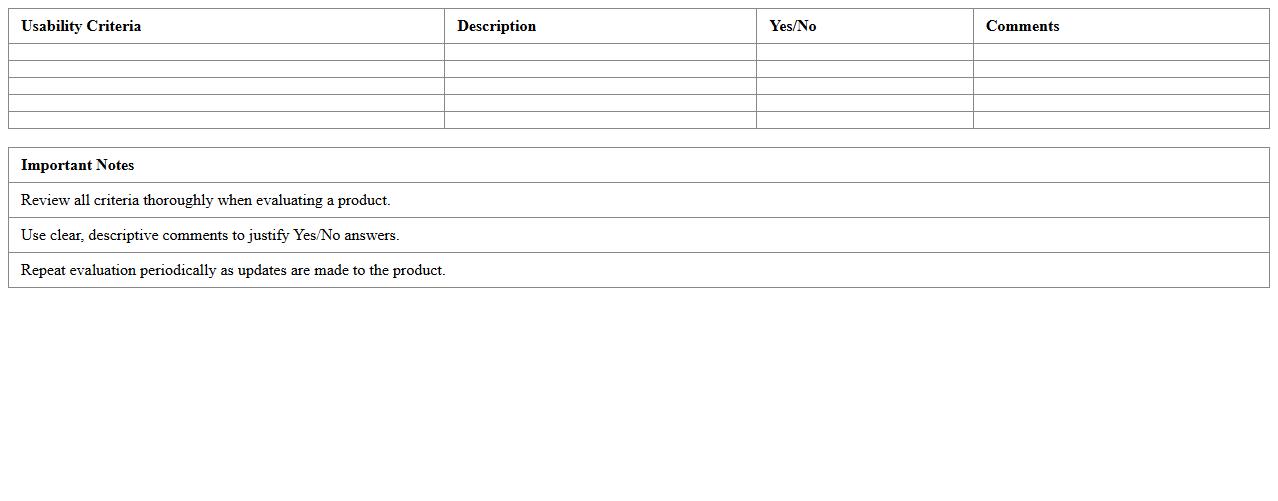
Product Usability Evaluation Checklist Spreadsheet
A
Product Usability Evaluation Checklist Spreadsheet document systematically organizes key usability criteria and testing outcomes, allowing teams to track user experience factors efficiently. It helps identify product strengths and weaknesses through quantifiable metrics, ensuring consistent application of usability standards across development stages. Utilizing this spreadsheet facilitates informed decision-making, leading to enhanced product design and improved user satisfaction.
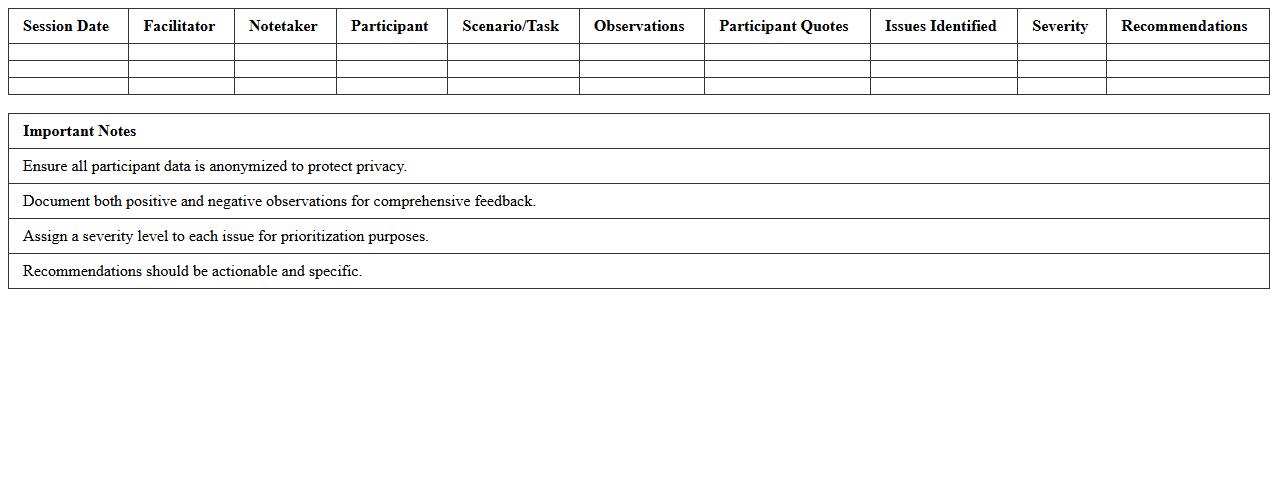
Usability Test Session Notes Excel Sheet
The
Usability Test Session Notes Excel Sheet document is a structured tool used to systematically record observations, participant feedback, and usability issues during user testing sessions. It helps teams organize and analyze qualitative and quantitative data efficiently, leading to clearer insights for improving product design and functionality. This document enhances collaboration by providing a centralized location for tracking test results and action items, ensuring that critical user experience issues are addressed effectively.
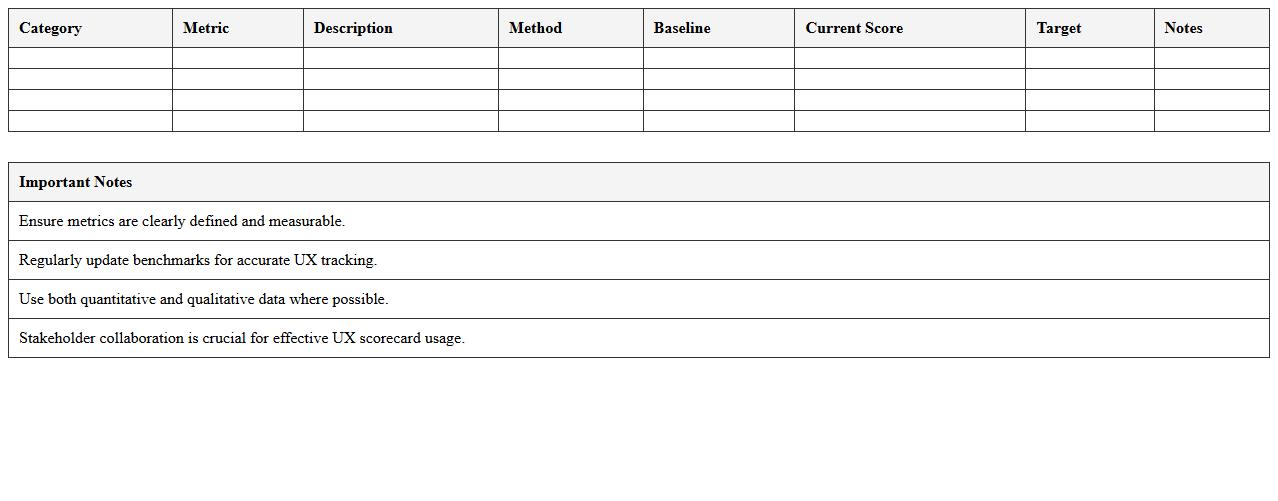
UX Scorecard & Benchmarking Excel Template
The
UX Scorecard & Benchmarking Excel Template is a comprehensive tool designed to evaluate and compare user experience metrics across different products or versions. It helps organizations systematically track usability, performance, and customer satisfaction data, enabling informed decision-making to improve digital interfaces. By visualizing key UX indicators, this template supports continuous enhancement of user-centered design strategies.
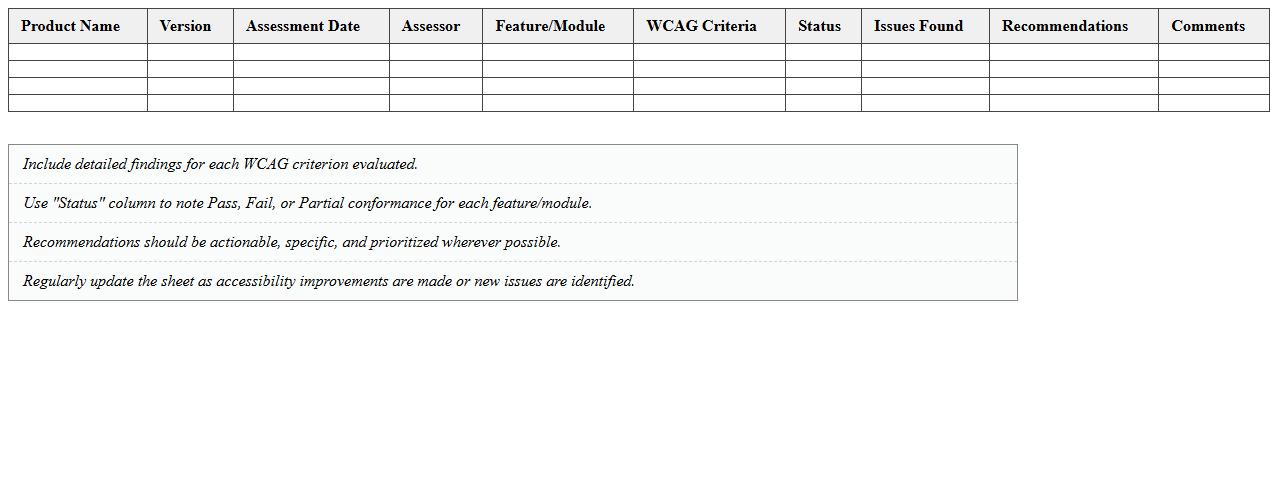
Product Accessibility Assessment Excel Sheet
The
Product Accessibility Assessment Excel Sheet is a structured document used to evaluate and track the accessibility features of a product, ensuring compliance with accessibility standards such as WCAG and ADA. It helps organizations systematically identify barriers, document user needs, and prioritize improvements to enhance usability for people with disabilities. This tool facilitates ongoing monitoring and reporting, supporting inclusive design and regulatory adherence throughout the product development lifecycle.
How do you track usability test results within the Product Usability Assessment Excel sheet?
You track usability test results in the Product Usability Assessment Excel sheet by creating organized columns for user tasks, errors, time on task, and satisfaction ratings. Each test session should be documented with detailed notes, allowing easy comparison across users and test cases. Consistently updating these records helps in identifying patterns and actionable insights.
Which Excel metrics best indicate user pain points in your product interface?
Error rates, task completion time, and user satisfaction scores are the key metrics to highlight pain points in Excel. High error rates indicate usability issues, while longer task times suggest complexity or confusion. User feedback scores complement these metrics by revealing subjective pain and frustration levels.
How do you tailor the assessment fields in Excel for different UX personas?
Tailoring assessment fields involves customizing columns based on persona characteristics such as experience level, goals, and preferred interaction style. Include personalized metrics like specific feature usage or navigation paths relevant to each persona. This targeted approach ensures that data captures meaningful differences among diverse user groups.
What formulas help visualize severity rankings in usability issues using Excel?
Formulas such as IF, VLOOKUP, and conditional aggregation assist in categorizing and ranking severity levels of usability problems. For instance, an IF formula can assign numerical severity based on predefined criteria, while conditional aggregation summarizes the count of issues per level. These combined formulas enable dynamic, clear visualization of critical versus minor issues.
How can conditional formatting in Excel emphasize critical UX feedback?
Conditional formatting highlights important UX feedback by applying color codes to cells based on thresholds or categories. For example, critical issues may appear in red, moderate issues in yellow, and minor issues in green. This visual differentiation quickly draws attention to areas requiring urgent improvement and enhances data readability.
More Assessment Excel Templates