The Annual Sales Plan Excel Template for Retail Stores provides a streamlined way to forecast sales, track monthly targets, and analyze performance metrics. It offers customizable sheets to input product categories, sales goals, and actual revenue, enabling retailers to adjust strategies in real time. Designed for ease of use, this template enhances decision-making and drives growth by organizing critical sales data efficiently.
Monthly Sales Tracker Excel Template for Retail Stores
The
Monthly Sales Tracker Excel Template for retail stores is a structured spreadsheet designed to record, analyze, and visualize sales data on a monthly basis. It helps retail managers monitor product performance, track revenue trends, and identify peak sales periods efficiently. Using this template enables accurate forecasting, inventory management, and strategic decision-making to improve overall store profitability.
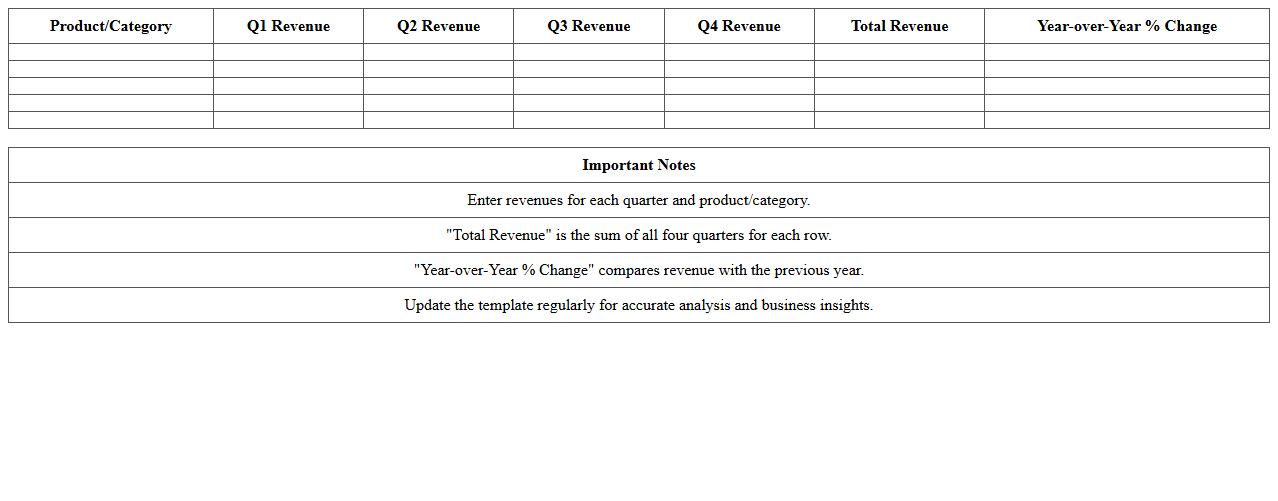
Quarterly Revenue Analysis Excel Sheet for Retail Business
A
Quarterly Revenue Analysis Excel Sheet for Retail Business is a detailed financial document that tracks and compares sales performance over each quarter, enabling businesses to identify trends, seasonality, and growth opportunities. It consolidates data such as total revenue, cost of goods sold, and profit margins, providing a clear visualization of financial health through charts and pivot tables. This tool is essential for strategic planning, budgeting, and making informed decisions that enhance profitability and operational efficiency.
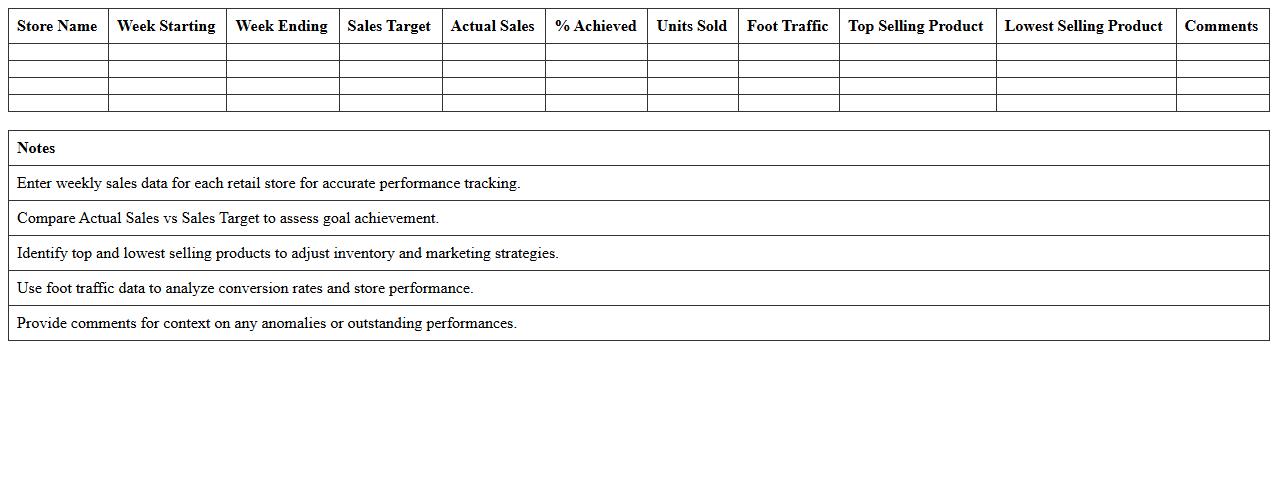
Weekly Sales Performance Report Spreadsheet for Retail Stores
The
Weekly Sales Performance Report Spreadsheet for retail stores is a comprehensive document designed to track and analyze sales data on a weekly basis, including metrics like total revenue, units sold, and product category performance. This spreadsheet helps store managers identify sales trends, monitor employee performance, and make data-driven decisions to optimize inventory and marketing strategies. By providing clear insights into sales dynamics, it enhances operational efficiency and supports steady business growth.
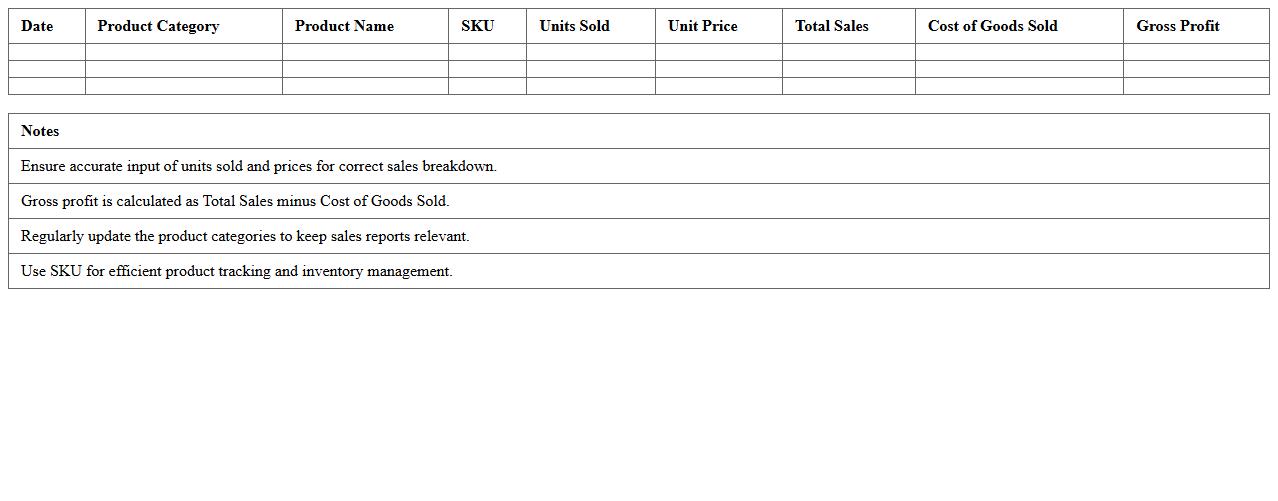
Product Category Sales Breakdown Excel Template for Retail
The
Product Category Sales Breakdown Excel Template for retail is a powerful tool designed to organize and analyze sales data by specific product categories, providing clear insights into performance trends. It helps retailers identify top-performing categories, track sales volume and revenue, and make data-driven decisions to optimize inventory and marketing strategies. Utilizing this template enhances financial forecasting accuracy and improves overall sales management efficiency.
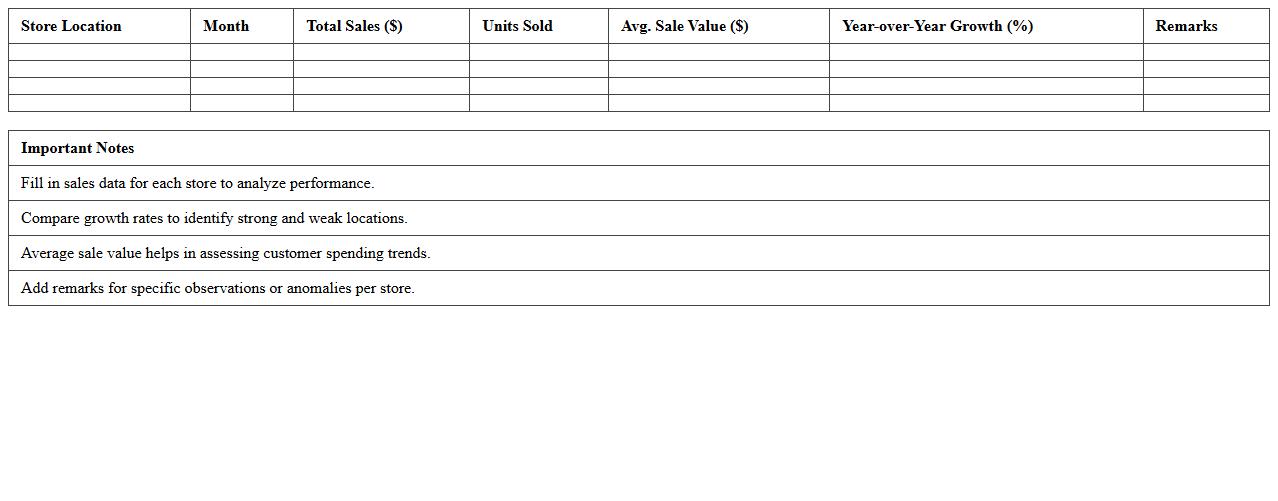
Store Location Sales Comparison Excel Sheet for Retail Chains
The
Store Location Sales Comparison Excel Sheet for retail chains is a powerful analytical tool designed to evaluate and compare sales performance across multiple store locations. It provides detailed insights into sales trends, helping retailers identify top-performing stores, pinpoint underperforming locations, and optimize inventory distribution. This document streamlines data-driven decision-making, enhances strategic planning, and ultimately boosts overall retail chain profitability.
Year-over-Year Sales Growth Tracking Excel Template
The
Year-over-Year Sales Growth Tracking Excel Template is a powerful financial tool designed to monitor and analyze sales performance across different periods by comparing current sales figures with those from previous years. It helps businesses identify growth trends, seasonal fluctuations, and areas needing improvement through visual charts and automated calculations. By providing clear insights into sales dynamics, this template supports strategic decision-making and fosters data-driven business growth.
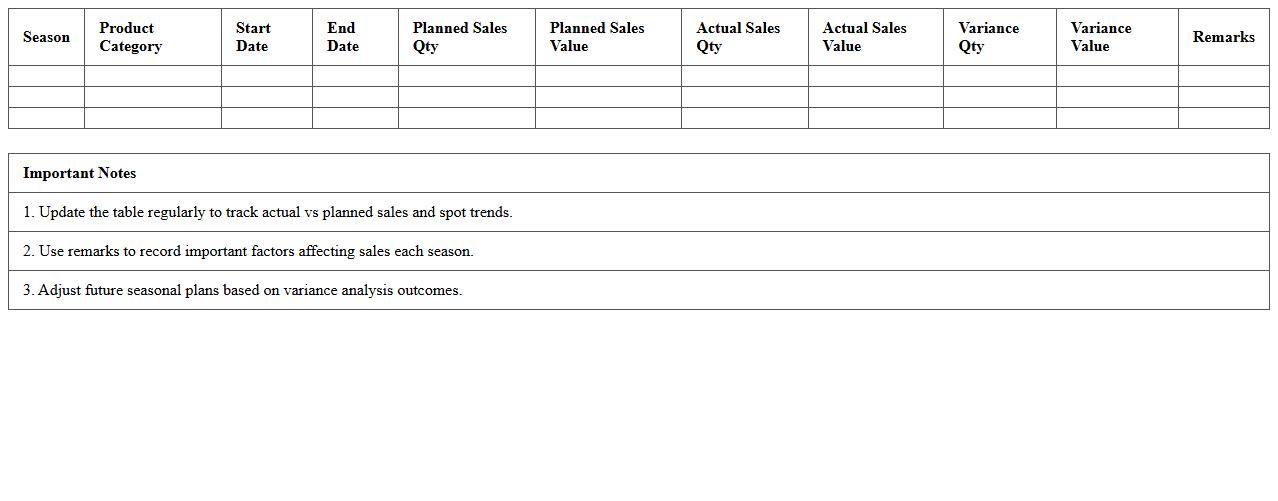
Seasonal Sales Planning Excel Template for Retailers
The
Seasonal Sales Planning Excel Template for Retailers is a comprehensive tool designed to help retailers forecast and manage inventory, sales targets, and promotional activities according to seasonal trends. It enables precise tracking of product demand fluctuations across different seasons, optimizing stock levels and minimizing overstock or shortages. By using this template, retailers can enhance their sales strategy, improve financial planning, and increase profitability through data-driven decisions tailored to seasonal market dynamics.
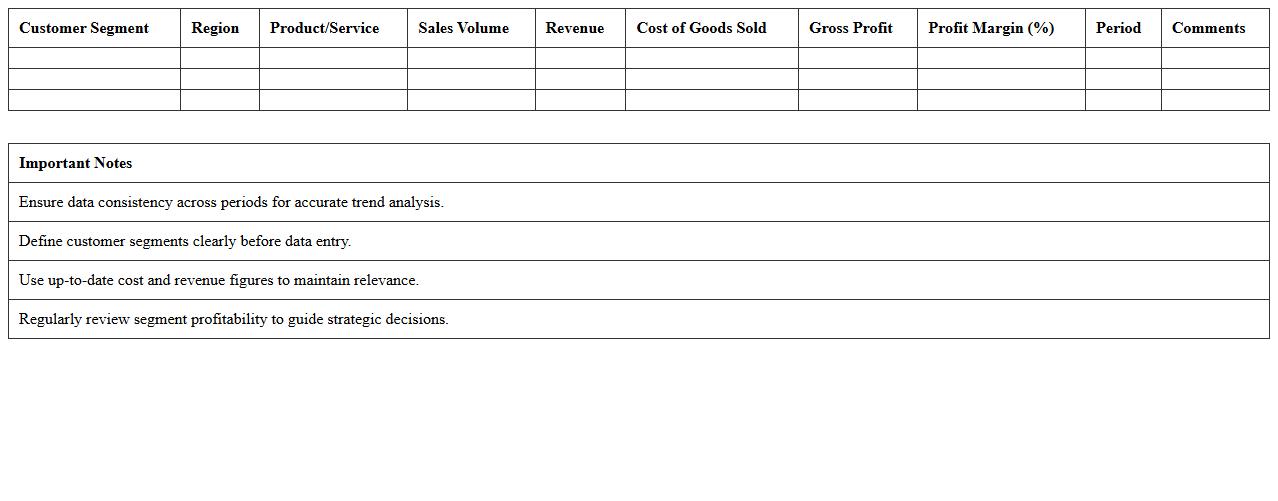
Customer Segment Sales Analysis Excel Template
The
Customer Segment Sales Analysis Excel Template is a structured spreadsheet designed to categorize sales data by distinct customer groups, enabling businesses to identify trends and preferences within each segment. This tool streamlines the analysis process by automating data visualization and calculations, helping to pinpoint high-value customers and optimize marketing strategies. Utilizing this template enhances decision-making, drives targeted sales efforts, and ultimately improves revenue growth through precise customer insights.
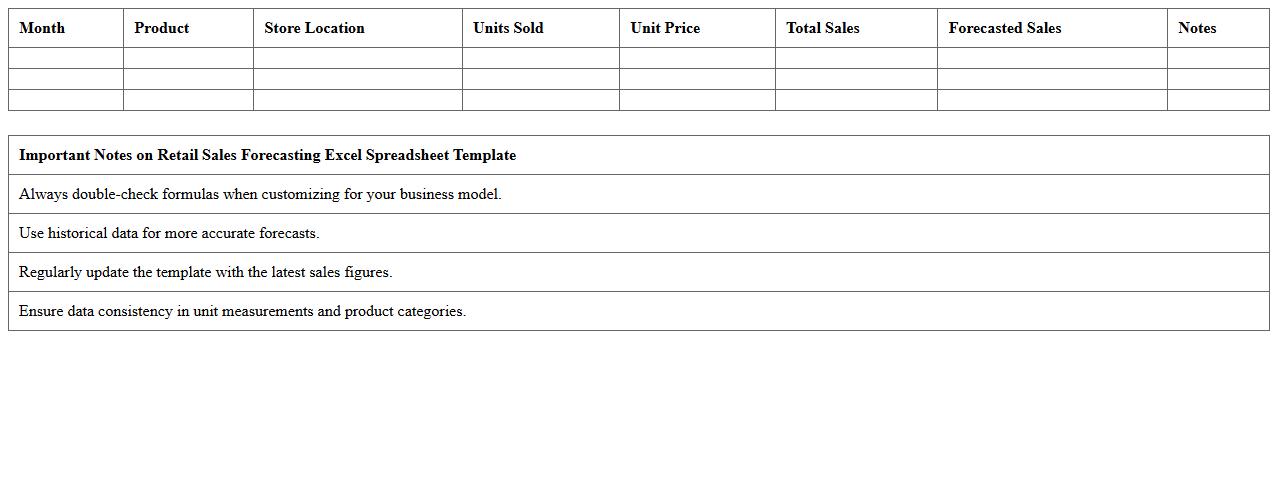
Retail Sales Forecasting Excel Spreadsheet Template
The
Retail Sales Forecasting Excel Spreadsheet Template is a powerful tool designed to project future sales based on historical data and market trends. This document helps businesses identify sales patterns, optimize inventory management, and make data-driven decisions to increase revenue. By using precise formulas and customizable fields, it streamlines the forecasting process, enhancing accuracy and efficiency in retail planning.
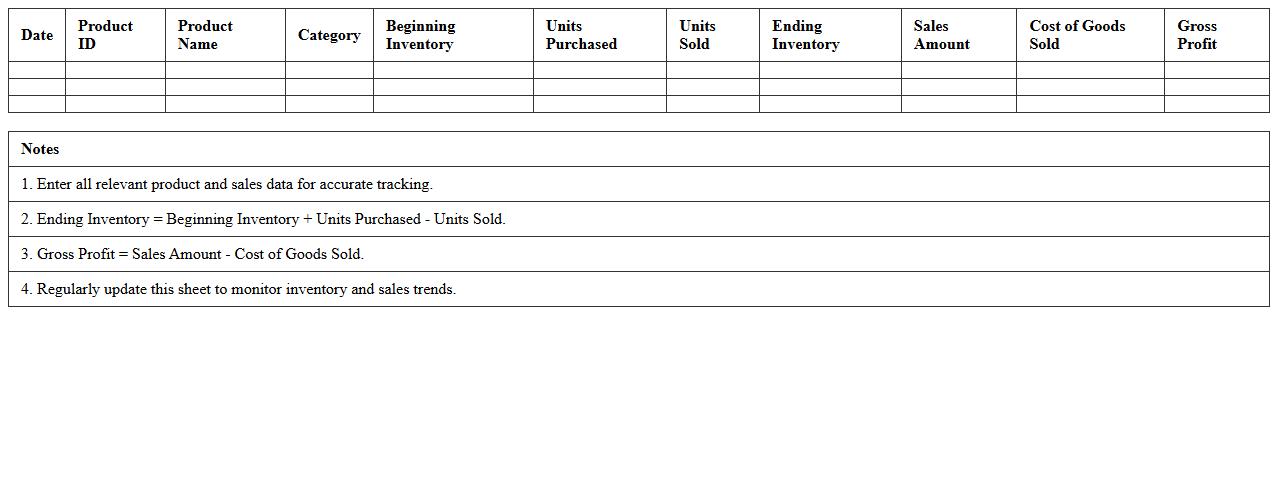
Inventory and Sales Correlation Excel Template for Retail
The
Inventory and Sales Correlation Excel Template for retail is a powerful tool designed to analyze the relationship between stock levels and sales performance efficiently. It helps retailers identify trends, optimize inventory management, and reduce overstock or stockouts by providing clear visual data correlations. This template enables better forecasting, improved decision-making, and increased profitability through accurate tracking of inventory turnover and sales patterns.
How can the Annual Sales Plan Excel template forecast monthly sales by product category for multi-location retail stores?
The Annual Sales Plan Excel template utilizes historical sales data segmented by product category and location to generate accurate monthly sales forecasts. It applies trend analysis and seasonal adjustment formulas to predict future demand. By leveraging dynamic pivot tables, the template consolidates sales projections across multiple store locations efficiently.
What formulas optimize inventory turnover analysis in the Annual Sales Plan Excel sheet?
Inventory turnover is optimized using formulas like Cost of Goods Sold (COGS) divided by Average Inventory to calculate turnover ratios. Conditional formatting highlights low turnover rates, facilitating quick identification of slow-moving products. Additionally, the template uses SUMIF and AVERAGEIF formulas to analyze inventory performance by product category accurately.
How does the template track actual vs. target sales KPIs for individual store managers?
The template tracks KPIs by comparing actual sales figures against predefined targets using simple subtraction and percentage variance formulas. Visual dashboards with data bars and charts enable managers to monitor performance in real-time. Automated alerts can be set up to notify when sales goals are unmet, enhancing accountability.
Which data columns should be included to analyze seasonal sales trends in the retail plan?
Crucial data columns include monthly sales volume, product category, store location, and date of sale. Incorporating holiday and promotion periods helps to capture external factors affecting sales. These columns support advanced analysis through time-series and seasonal decomposition techniques.
Can the Annual Sales Plan Excel model integrate with POS systems for real-time sales data updates?
Yes, the model can integrate with POS systems using Excel's Power Query to import real-time sales data directly. Automated data refreshes ensure the sales plan stays current without manual input. This integration improves accuracy and enables dynamic decision-making based on live sales figures.
More Plan Excel Templates