The Demand Forecast Excel Template for Retail Stores helps businesses accurately predict future product demand using historical sales data and seasonal trends. It streamlines inventory management by providing customizable charts and automated calculations, reducing stockouts and overstock costs. Retailers can enhance decision-making and improve profitability with this user-friendly forecasting tool.
Weekly Demand Forecast Excel Template for Retail Stores
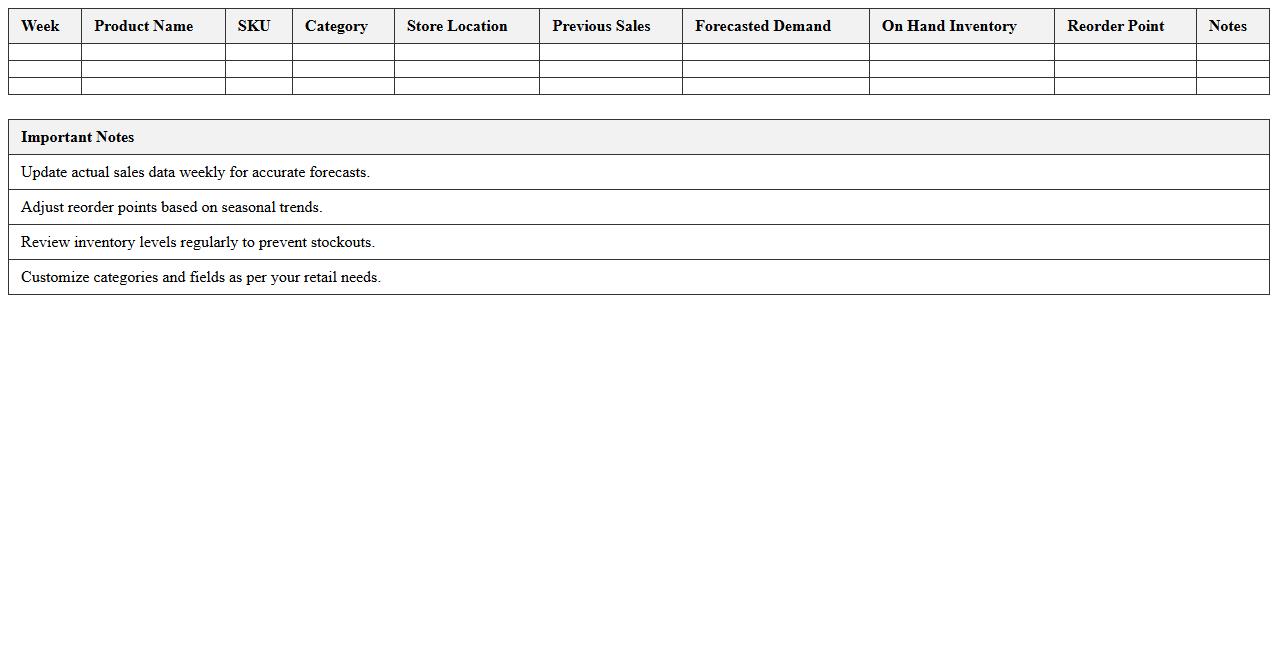
The
Weekly Demand Forecast Excel Template for Retail Stores is a structured spreadsheet designed to predict customer demand for various products on a weekly basis. It allows retailers to analyze past sales data, identify trends, and prepare accurate inventory plans, reducing stockouts and overstock situations. This tool enhances decision-making efficiency by providing clear, actionable insights into expected product demand.
Seasonal Sales Forecast Spreadsheet for Retail Chains
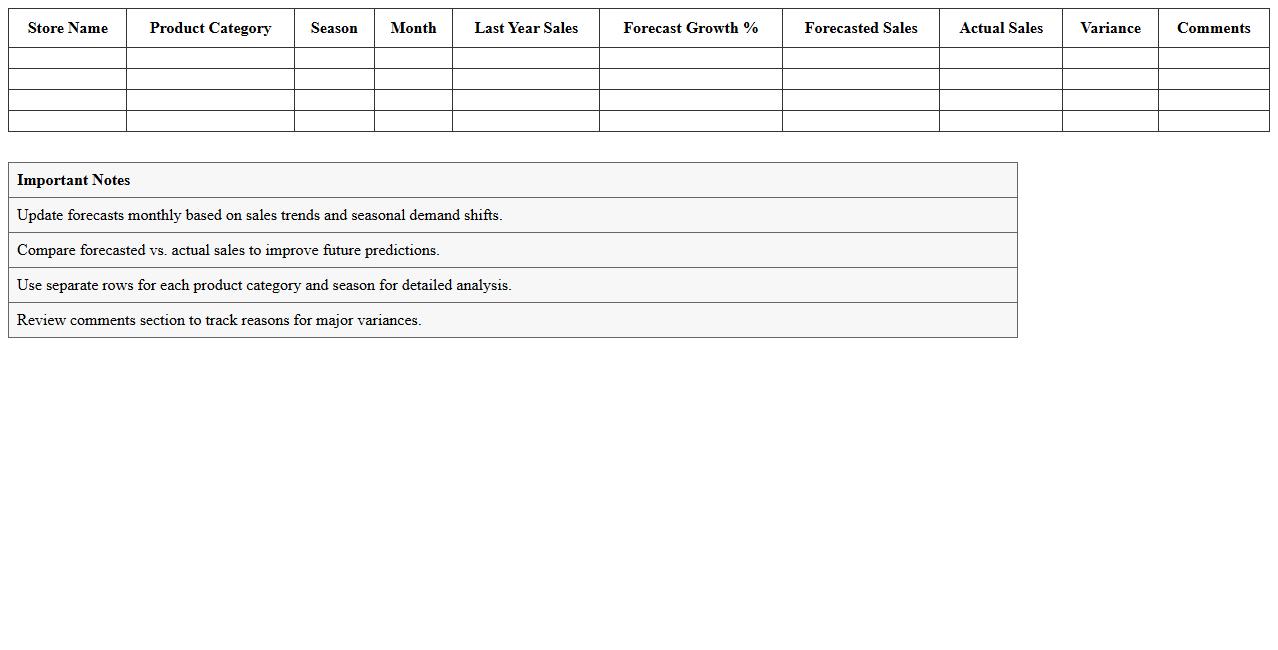
The
Seasonal Sales Forecast Spreadsheet for Retail Chains is a detailed tool designed to predict sales patterns based on historical data and seasonal trends. By analyzing factors such as past sales, holidays, and market fluctuations, it enables retail chains to optimize inventory management and staffing levels. This forecast model helps reduce stockouts and overstock situations, ultimately improving profitability and operational efficiency.
Multi-Location Retail Demand Planning Excel Sheet
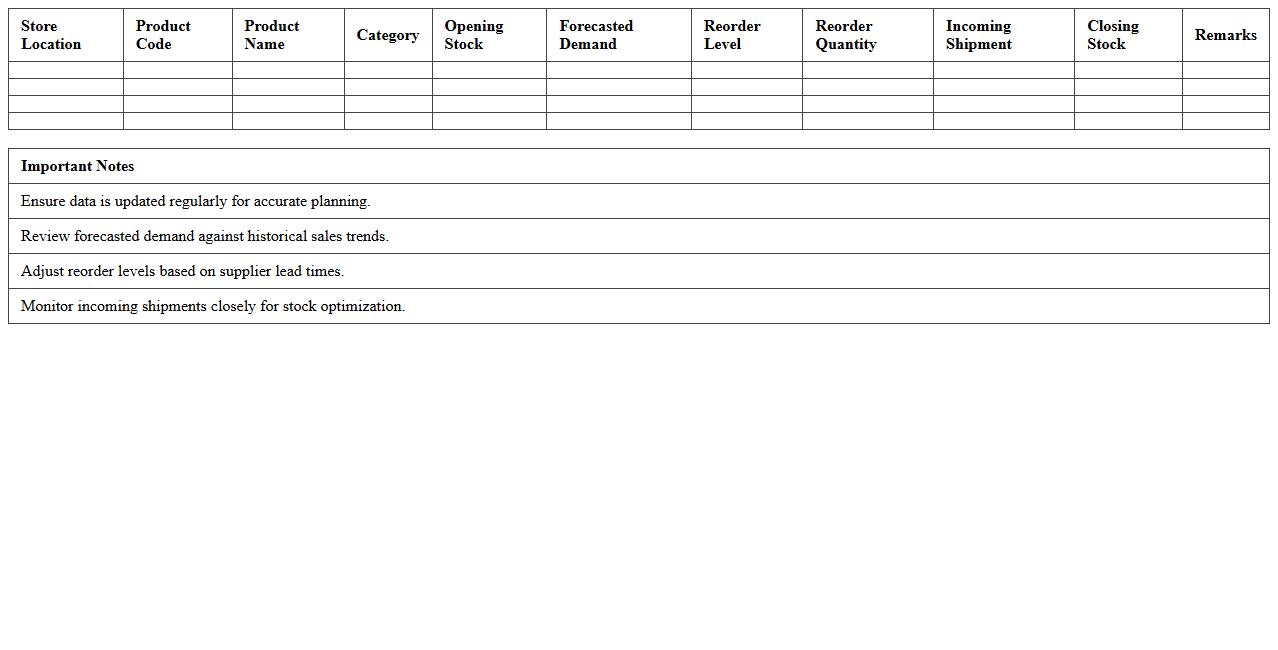
A
Multi-Location Retail Demand Planning Excel Sheet is a dynamic tool designed to forecast product demand across various retail locations, enabling efficient inventory management and minimizing stockouts or overstock situations. By analyzing historical sales data, seasonal trends, and promotional activities, this document facilitates accurate demand predictions at each store, optimizing supply chain operations and improving customer satisfaction. Retailers leverage this spreadsheet to align procurement, distribution, and sales strategies, ensuring resources are allocated effectively across multiple sites.
SKU-Level Inventory Forecasting Template for Retailers
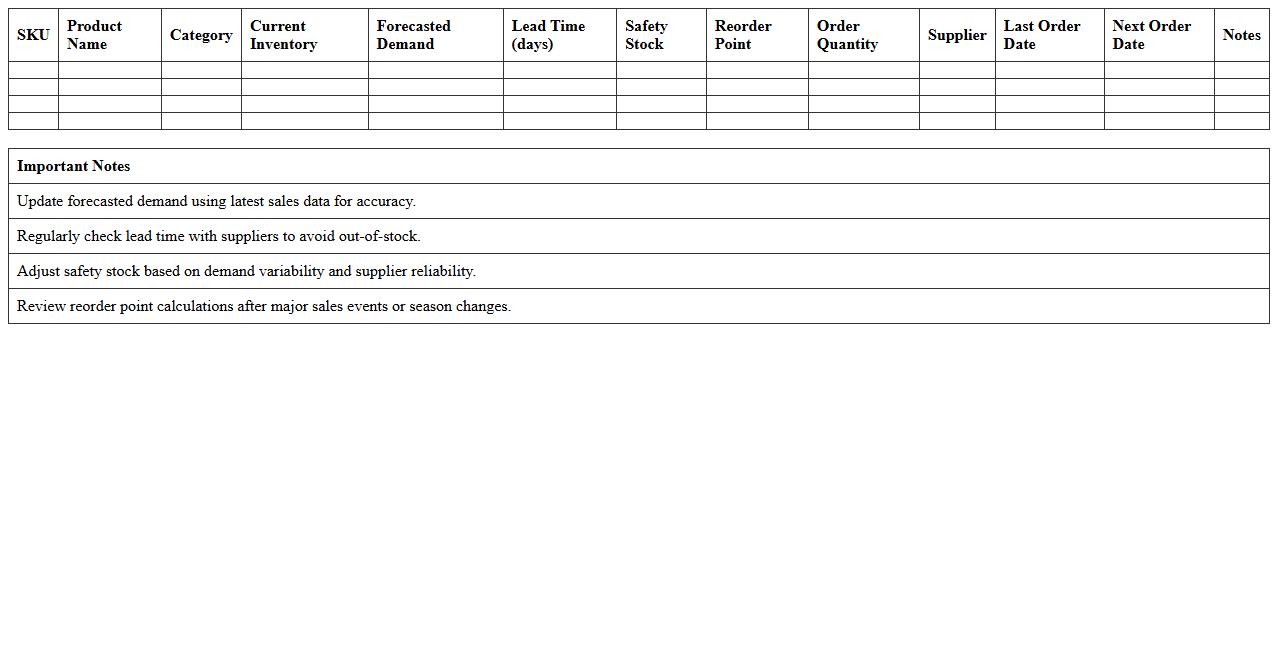
The
SKU-Level Inventory Forecasting Template for retailers is a detailed tool designed to predict future product demand at the individual Stock Keeping Unit (SKU) level. This template helps retailers optimize inventory management by providing accurate forecasts that reduce stockouts and overstock situations, thereby improving cash flow and customer satisfaction. Utilizing historical sales data and trend analysis, it enables precise planning for procurement, promotions, and replenishment cycles, ensuring efficient supply chain operations.
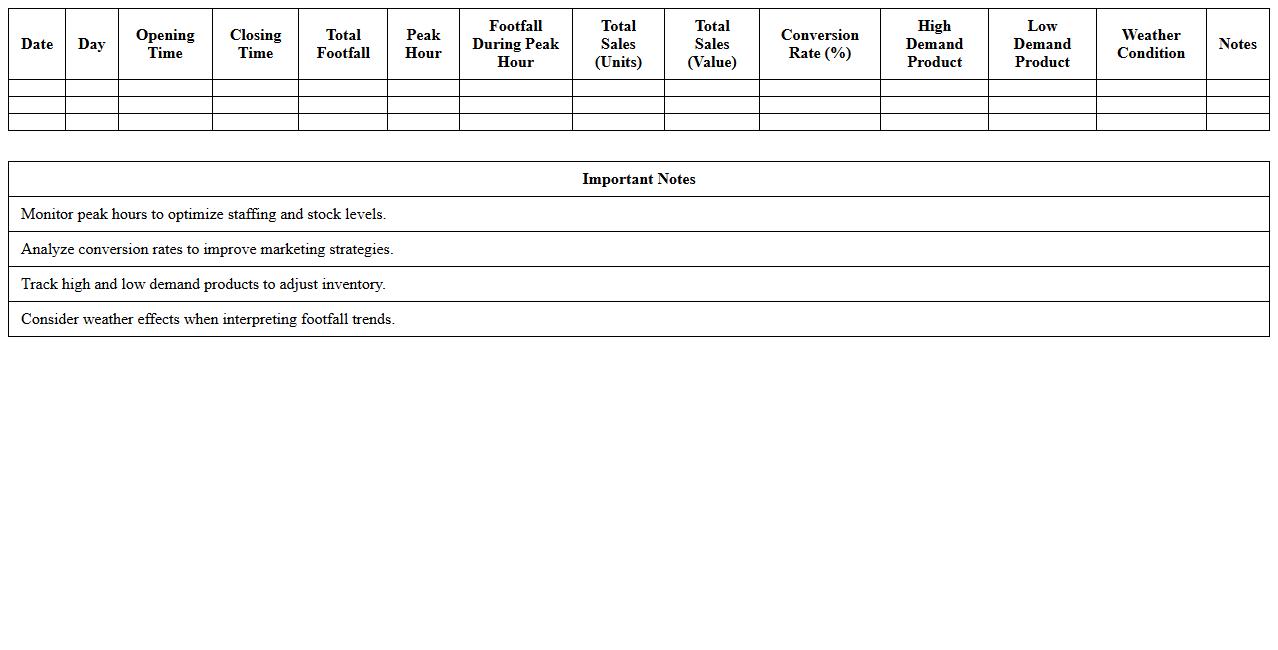
Retail Store Footfall and Demand Analysis Excel
Retail Store Footfall and Demand Analysis Excel document tracks and visualizes customer traffic patterns and purchasing behavior within a store. This tool helps identify peak hours, optimize staffing, and enhance inventory management by analyzing footfall metrics alongside sales data. Using this
data-driven approach enables retailers to improve operational efficiency and boost revenue through informed decision-making.
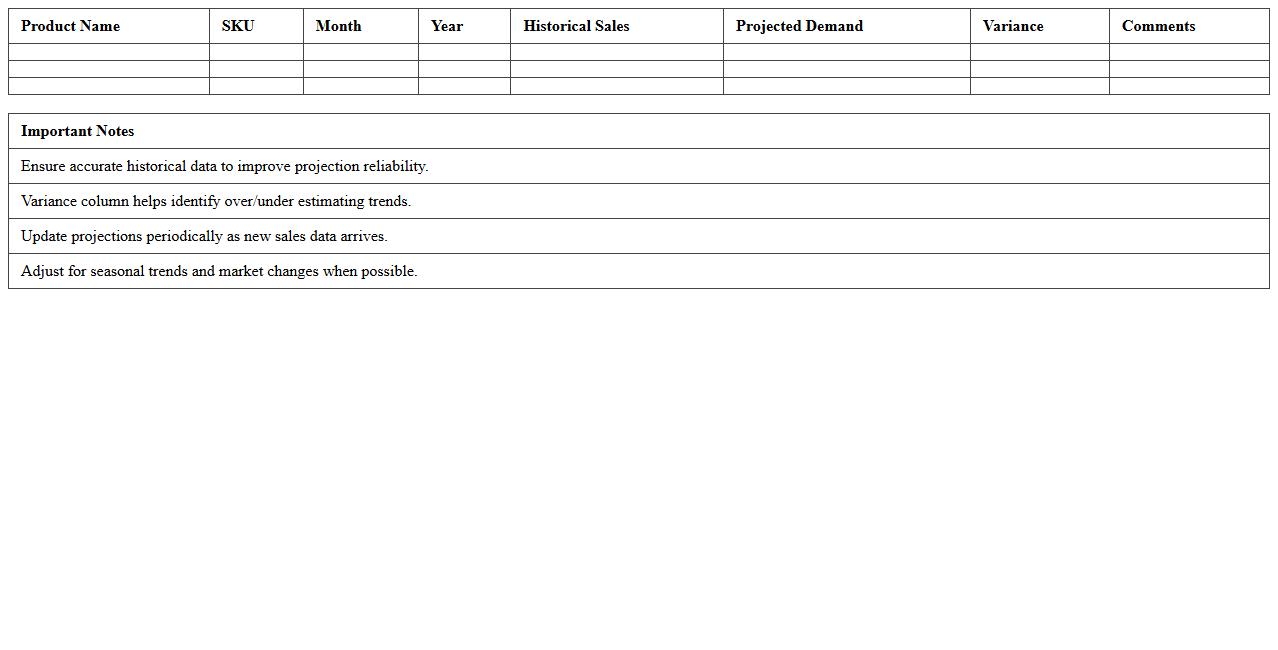
Historical Sales Demand Projection Excel Template
The
Historical Sales Demand Projection Excel Template is a powerful tool designed to analyze past sales data and generate accurate future demand forecasts. By utilizing historical sales figures, seasonality trends, and market patterns, this template helps businesses optimize inventory management and improve supply chain efficiency. It enables decision-makers to reduce stockouts, minimize excess inventory, and enhance overall sales planning strategies.
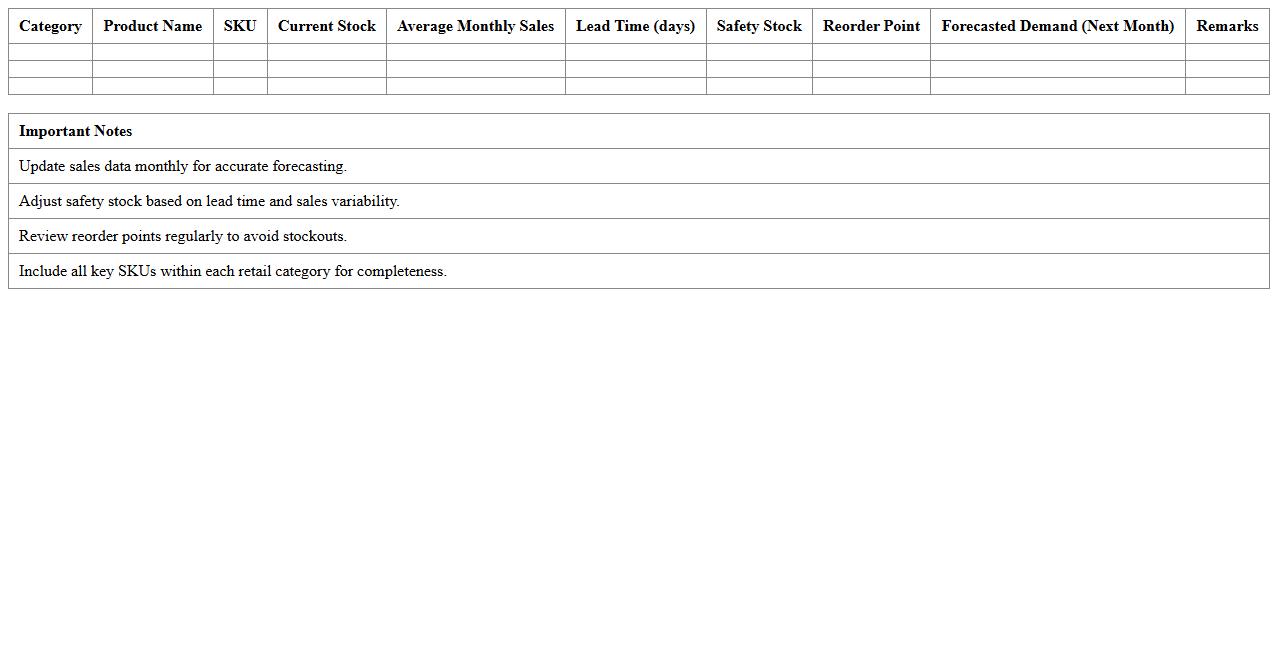
Retail Category Demand Planning Spreadsheet
A
Retail Category Demand Planning Spreadsheet document is a strategic tool used to forecast product demand across various retail categories by analyzing historical sales data, market trends, and seasonal factors. It helps businesses optimize inventory levels, reduce stockouts or overstock situations, and improve supply chain efficiency. By accurately predicting consumer demand, retailers can enhance sales performance, streamline procurement processes, and make informed decisions to meet market needs effectively.
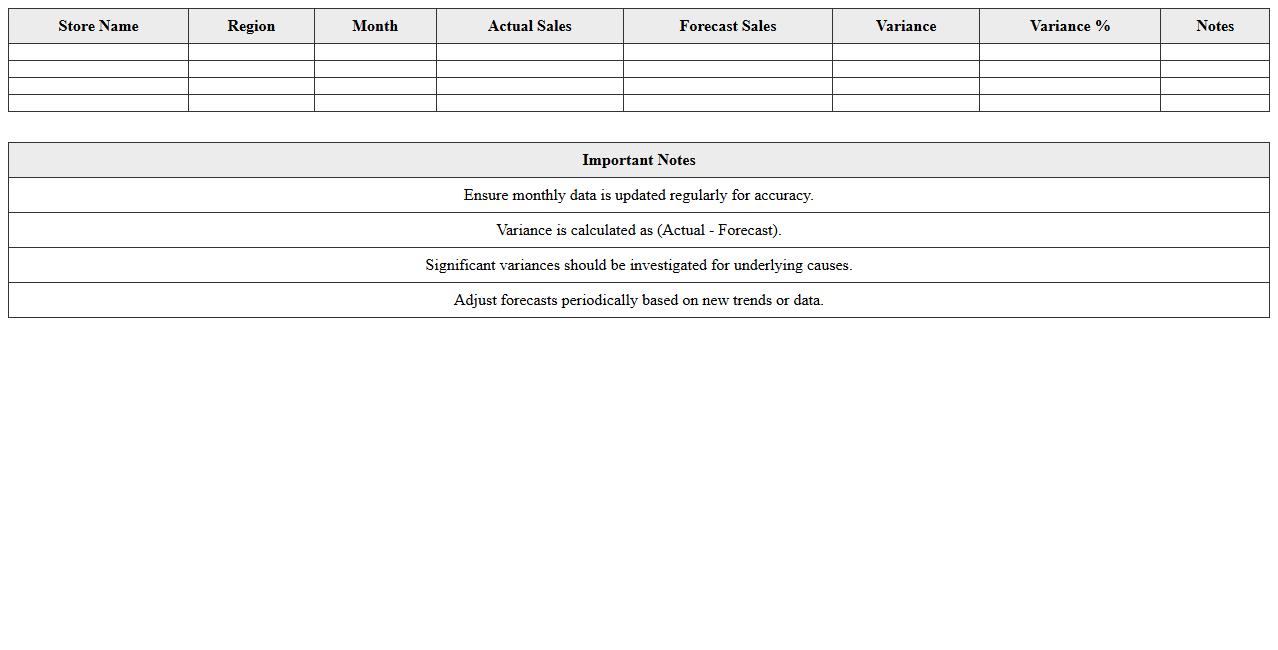
Storewise Sales Trend Forecast Excel Sheet
The
Storewise Sales Trend Forecast Excel Sheet document is a data-driven tool designed to analyze and predict sales patterns across multiple store locations. By consolidating historical sales data, it enables businesses to identify seasonal trends, forecast future demand, and optimize inventory management. This sheet helps improve decision-making processes, increase sales efficiency, and reduce stockouts or overstock situations.
Product-Level Retail Demand Tracker Excel
The
Product-Level Retail Demand Tracker Excel document is a tool designed to monitor and analyze sales data for individual products across various retail outlets. It enables businesses to identify demand patterns, optimize inventory management, and make informed decisions on product stocking and promotions. By tracking granular sales metrics, companies can improve forecasting accuracy and enhance overall supply chain efficiency.
Automated Demand Planning Dashboard for Retail in Excel
The
Automated Demand Planning Dashboard for retail in Excel is a dynamic tool designed to analyze sales data, forecast demand, and optimize inventory levels. It integrates historical sales, seasonal trends, and market variables within an interactive Excel interface, allowing retailers to make informed decisions quickly. This dashboard reduces manual forecasting errors, enhances supply chain efficiency, and ensures better stock availability, ultimately driving higher customer satisfaction and profitability.
How can you automate seasonal demand forecasting in Excel for retail inventory planning?
Automating seasonal demand forecasting in Excel involves using historical sales data combined with time series analysis tools. You can leverage Excel functions like FORECAST.ETS to identify and project seasonal patterns accurately. Utilizing dynamic named ranges and tables ensures your model updates automatically as new data is added.
What Excel formulas are best for calculating forecast accuracy in store-level sales data?
To calculate forecast accuracy in sales data, Excel formulas such as MAPE (Mean Absolute Percentage Error), MAE (Mean Absolute Error), and RMSE (Root Mean Square Error) are essential. These formulas help quantify the deviation between actual and forecasted sales, providing a clear measure of accuracy. Implementing these in a structured way assists in continuous monitoring and improvement of your forecasts.
How do you structure a multi-store demand forecast template in Excel for easy aggregation?
Structuring a multi-store demand forecast template requires separate sheets or tables for each store's data, standardized with the same format and columns. Using PivotTables enables quick aggregation and comparison across different stores and product categories. Incorporating data validation and dynamic ranges helps maintain consistency and scalability.
Which data visualization tools in Excel enhance demand trend analysis for retail products?
Excel's Line Charts, PivotCharts, and Sparklines are powerful tools for visualizing demand trends effectively. These visuals help detect seasonality, spikes, and declines in retail product sales over time. Conditional formatting can also highlight important patterns or anomalies directly within your data tables.
How can Excel's Solver optimize order quantities based on demand forecasts for retail stores?
Excel's Solver can optimize order quantities by setting constraints such as budget limits, storage capacity, and minimum stock levels combined with forecasted demand. By defining an objective function to minimize costs or maximize service levels, Solver finds the best order quantities per product and store. This enhances inventory efficiency and reduces the risk of overstock or stockouts.
More Forecast Excel Templates