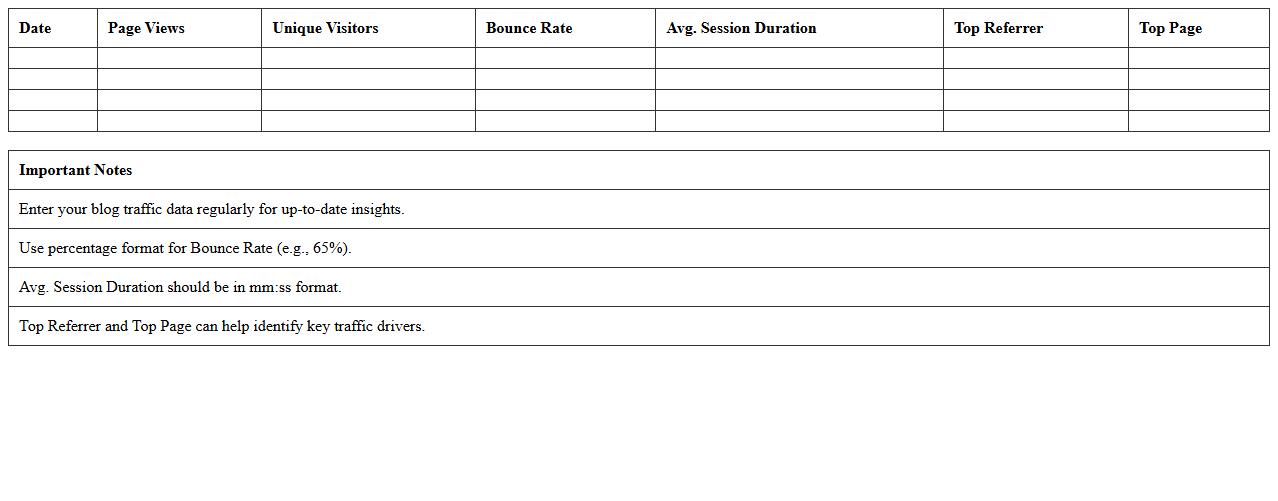
Blog Traffic Overview Excel Dashboard Template
The
Blog Traffic Overview Excel Dashboard Template is a powerful tool that consolidates key metrics such as visitor count, page views, bounce rate, and traffic sources into a single, easy-to-read interface. It allows bloggers and digital marketers to monitor their website performance trends, identify high-performing content, and make data-driven decisions to increase engagement. This template streamlines data analysis, saving time and improving the accuracy of blog traffic assessments for better growth strategies.
Monthly Website Visitors Tracking Spreadsheet
A
Monthly Website Visitors Tracking Spreadsheet document systematically records and analyzes the number of visitors to a website each month, providing valuable data on traffic patterns and user engagement. This tool helps identify trends, measure the effectiveness of marketing campaigns, and optimize content strategies based on visitor behavior. By tracking these metrics consistently, businesses can make informed decisions to improve website performance and increase overall audience growth.
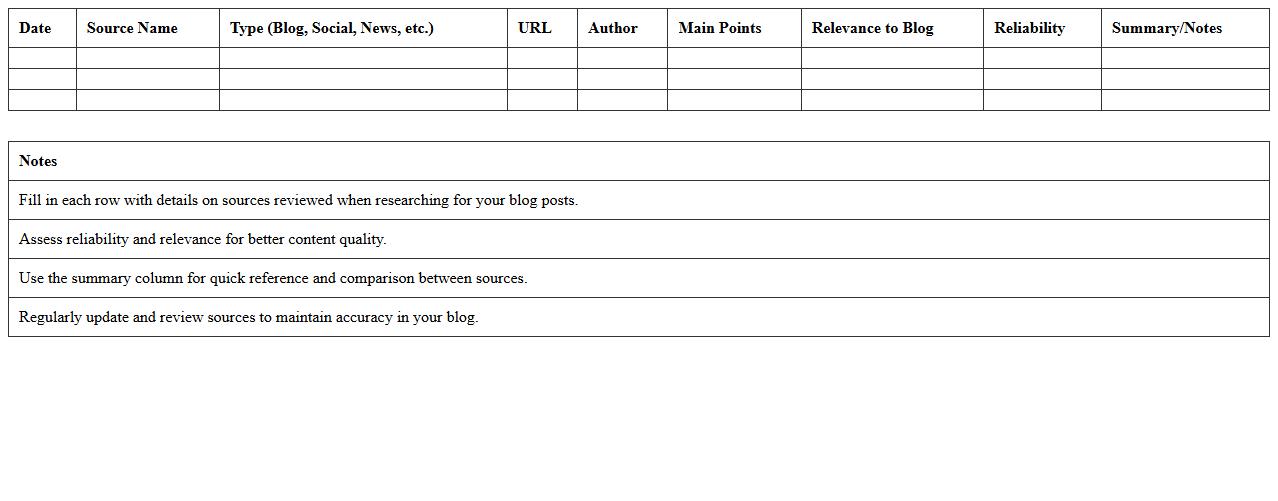
Source Analysis Report Excel Template for Bloggers
The
Source Analysis Report Excel Template for Bloggers is a structured document designed to help bloggers organize, evaluate, and track the performance of various traffic sources driving visitors to their websites. This template allows for systematic comparison of referral data, social media metrics, and campaign effectiveness, enabling bloggers to identify high-performing sources and optimize their content strategy accordingly. By consolidating all relevant analytics in one place, it streamlines decision-making and enhances the ability to increase audience engagement and website traffic.
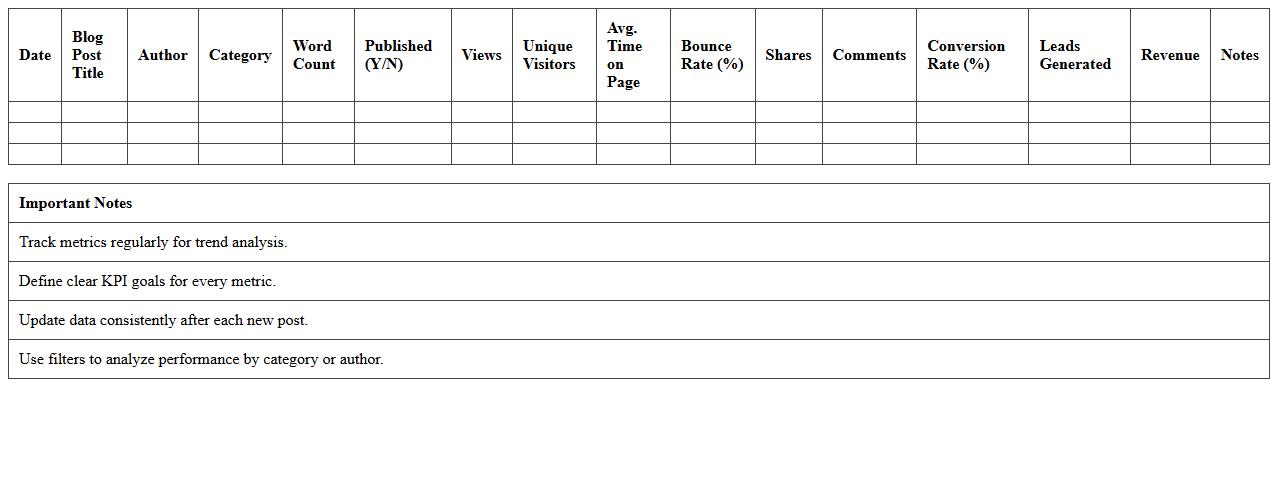
Blog Post Performance Metrics Excel Sheet
The
Blog Post Performance Metrics Excel Sheet is a comprehensive tool designed to track and analyze key performance indicators such as page views, engagement rate, bounce rate, and conversion metrics for individual blog posts. This document enables content creators and marketers to identify high-performing topics, optimize SEO strategies, and improve audience targeting by providing clear data visualization and trend analysis. By leveraging these insights, teams can enhance content effectiveness, drive more traffic, and achieve better ROI on their blogging efforts.
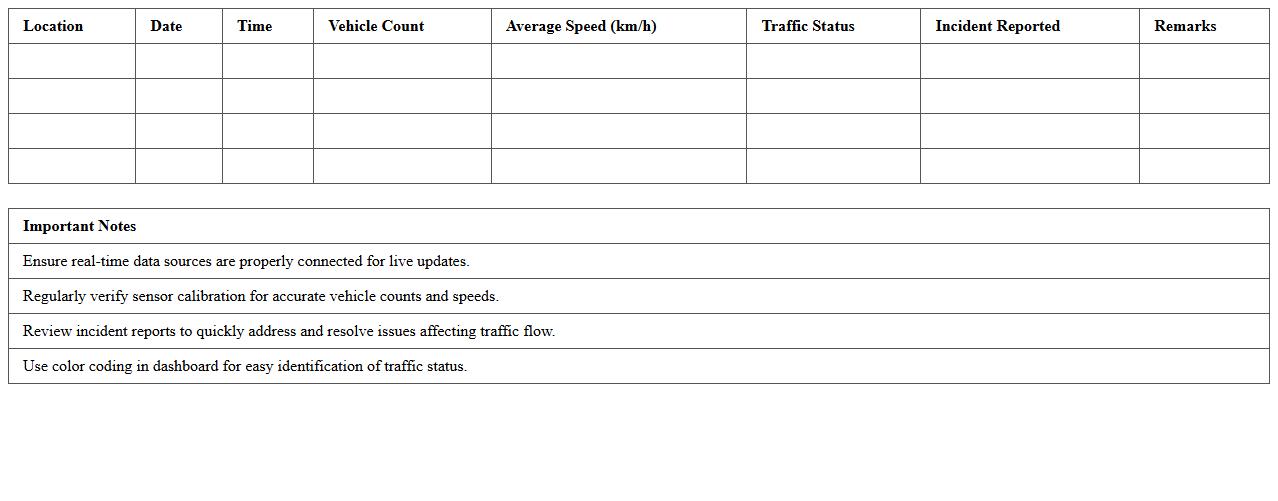
Real-Time Traffic Monitoring Excel Dashboard
A
Real-Time Traffic Monitoring Excel Dashboard document is a dynamic tool designed to track and visualize live traffic data including vehicle counts, speeds, and congestion levels. It enables efficient management of traffic flow by providing instant insights and trend analysis, helping urban planners and traffic control authorities make informed decisions. The dashboard's integration with real-time data sources enhances situational awareness and supports proactive measures to reduce traffic delays and improve road safety.
SEO Traffic Tracking Excel Template for Content Creators
The
SEO Traffic Tracking Excel Template for content creators is a powerful tool designed to monitor and analyze website traffic data efficiently. It helps track key metrics such as organic visits, keyword performance, and user engagement, enabling content creators to optimize their strategies for better search engine rankings. By organizing and visualizing SEO data in a clear, structured format, this template supports informed decision-making and performance improvements.
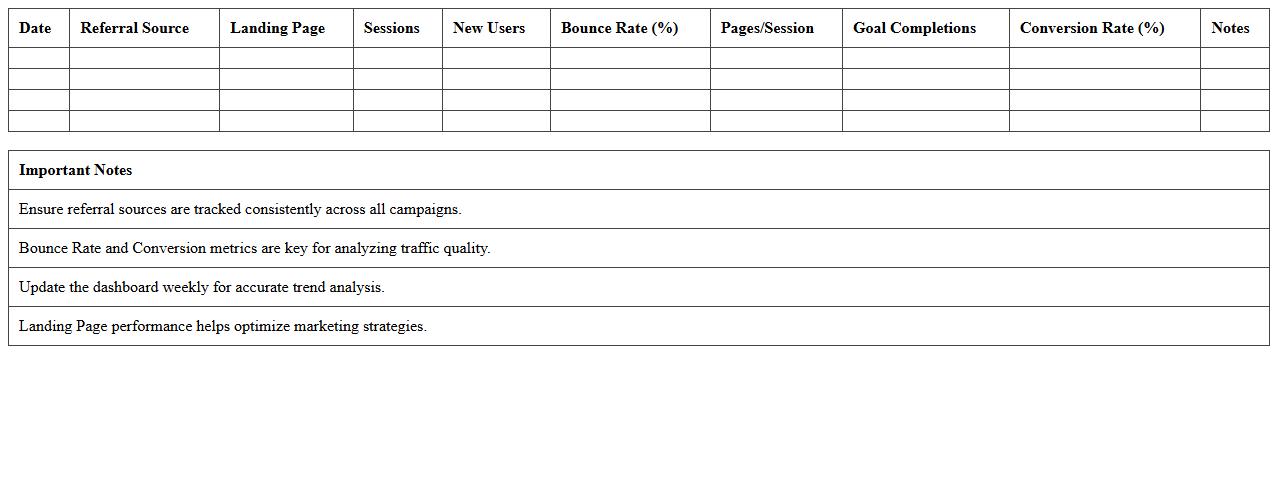
Website Referral Source Analysis Excel Spreadsheet
A
Website Referral Source Analysis Excel Spreadsheet document tracks and organizes data about where website visitors originate, such as search engines, social media platforms, or direct URL entries. This spreadsheet helps businesses identify the most effective marketing channels by analyzing referral traffic patterns, enabling data-driven decisions to optimize digital marketing strategies. It is especially useful for improving conversion rates and increasing return on investment by focusing resources on the highest-performing referral sources.
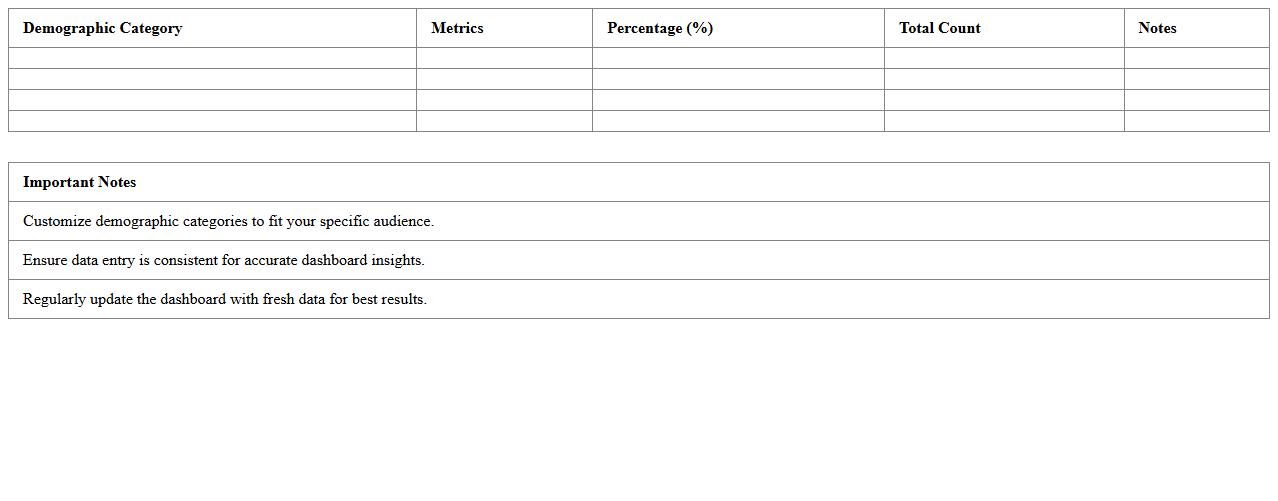
Audience Demographics Dashboard Excel Template
The
Audience Demographics Dashboard Excel Template is a powerful tool designed to visualize and analyze demographic data such as age, gender, location, and interests of a target audience. It enables marketers, business analysts, and content creators to identify key patterns and trends, facilitating data-driven decision making and targeted marketing strategies. By consolidating complex data into clear, interactive charts and graphs, it enhances understanding of customer segments and optimizes campaign effectiveness.
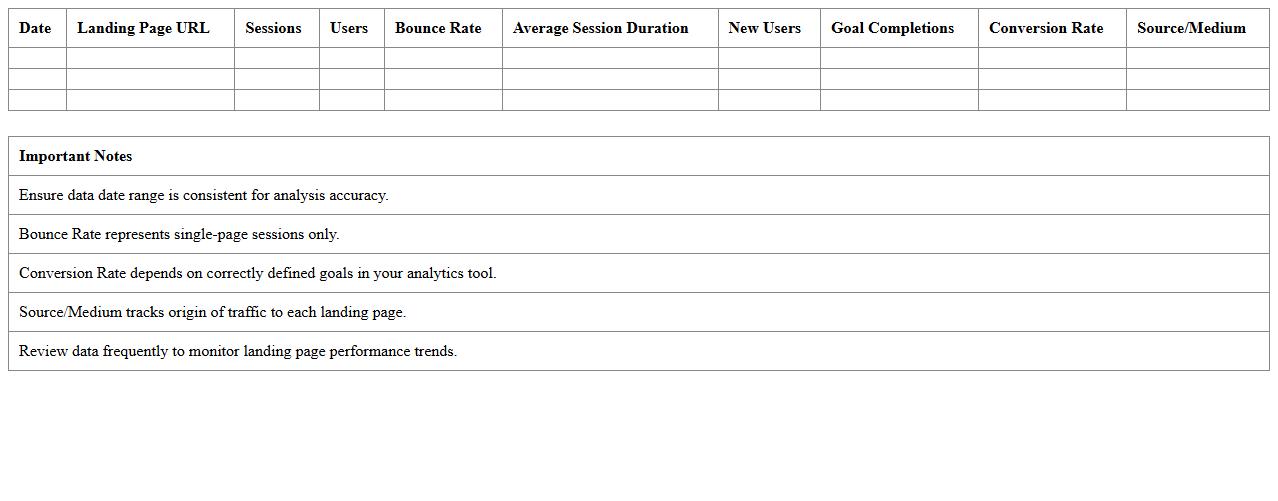
Landing Page Traffic Analysis Excel Report
The
Landing Page Traffic Analysis Excel Report document compiles key metrics such as visitor count, bounce rate, average session duration, and conversion rates for specific landing pages. This report enables marketers and web analysts to identify which landing pages perform best and understand user behavior, facilitating data-driven decisions to enhance website effectiveness. By leveraging these insights, businesses can optimize traffic sources and improve overall digital marketing strategies.
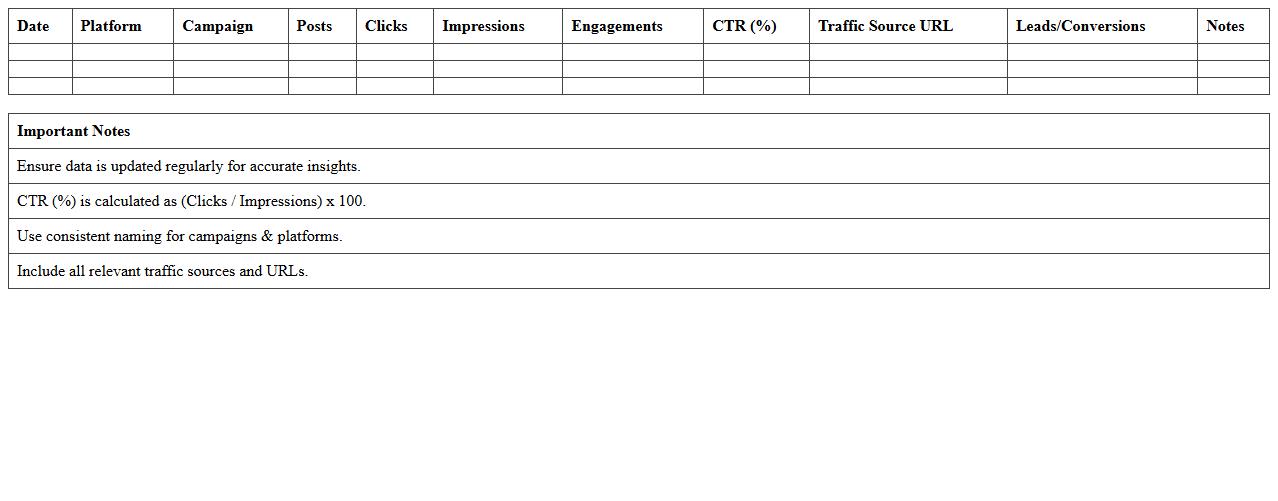
Social Media Traffic Insights Excel Template
The
Social Media Traffic Insights Excel Template is a comprehensive tool designed to analyze and visualize data from various social media platforms, helping users track engagement, traffic sources, and audience behavior effectively. It enables marketers and businesses to identify trends, measure campaign performance, and optimize content strategies based on detailed metrics such as click-through rates, impressions, and conversions. By centralizing social media data in one customizable spreadsheet, it facilitates informed decision-making and enhances overall digital marketing efficiency.
How can I automate monthly traffic data imports into my Website Traffic Dashboard Excel for efficient tracking?
To automate monthly traffic data imports, use Power Query in Excel to connect directly to your traffic source APIs or CSV files. Schedule updates to refresh data seamlessly each month without manual intervention. This approach ensures your dashboard is always populated with the latest metrics for efficient tracking.
What custom metrics should bloggers include in an Excel dashboard for detailed audience analysis?
Bloggers should track unique visitors, bounce rate, and average session duration to understand audience engagement deeply. Including metrics like pages per session and conversion rates helps measure content effectiveness. Custom metrics tailored to your blog's goals provide actionable insights for growth.
Which Excel formulas best visualize referral sources in a website traffic dashboard for bloggers?
Use SUMIF and PIVOT TABLES to aggregate traffic by referral source effectively within Excel. The CONCATENATE or TEXTJOIN functions help label sources clearly in charts. Combining these formulas enables intuitive data visualization of where your visitors come from.
How do I compare post performance over time using conditional formatting in a blogger's traffic dashboard?
Apply conditional formatting to highlight trends such as increasing or decreasing post views using color scales or icon sets. Use formulas like IF to flag posts outperforming average traffic. This technique visually emphasizes performance changes over time for quick analysis.
What are advanced filtering techniques for segmenting blog traffic by device in an Excel dashboard?
Leverage slicer controls and advanced filter features to segment traffic data by device types like mobile, desktop, or tablet. Use dynamic arrays or FILTER formulas for real-time segmentation based on user inputs. These methods enhance the dashboard's interactivity and precision in analyzing device-specific traffic.