The Control Chart Excel Template for Manufacturing Quality is designed to help monitor and analyze production processes by tracking variations and identifying trends. This template enables manufacturers to easily visualize data, ensuring consistent product quality and timely detection of defects. Utilizing this tool streamlines quality control efforts and supports continuous improvement initiatives.
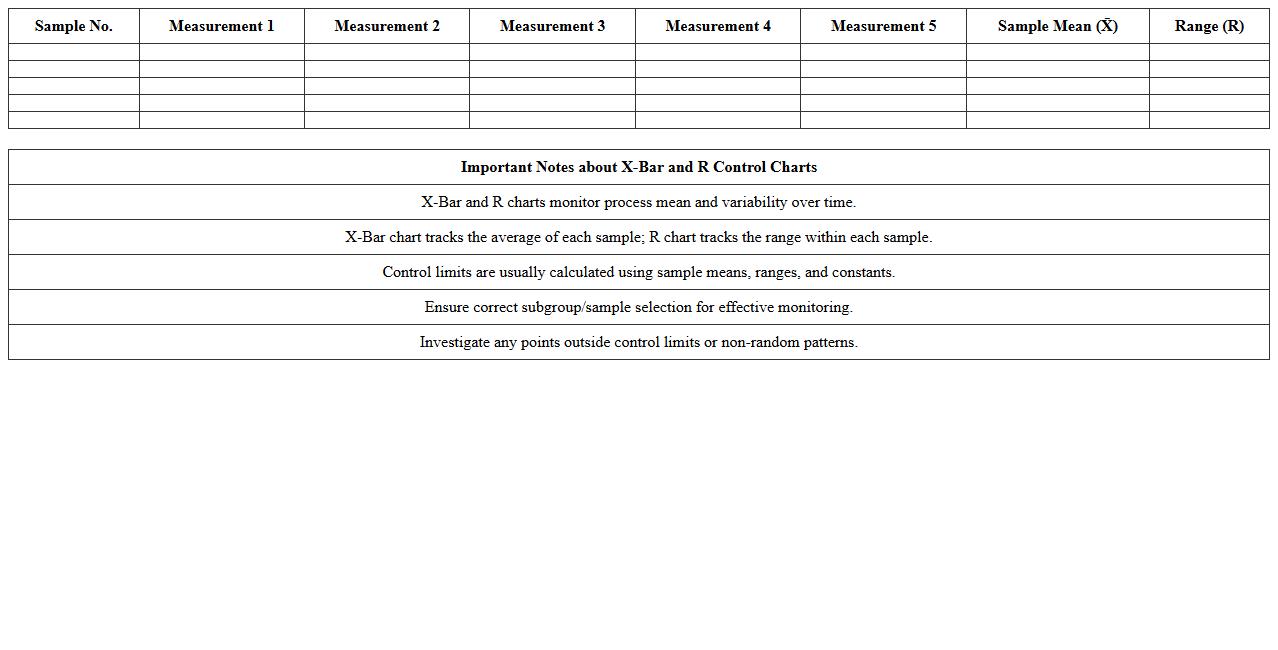
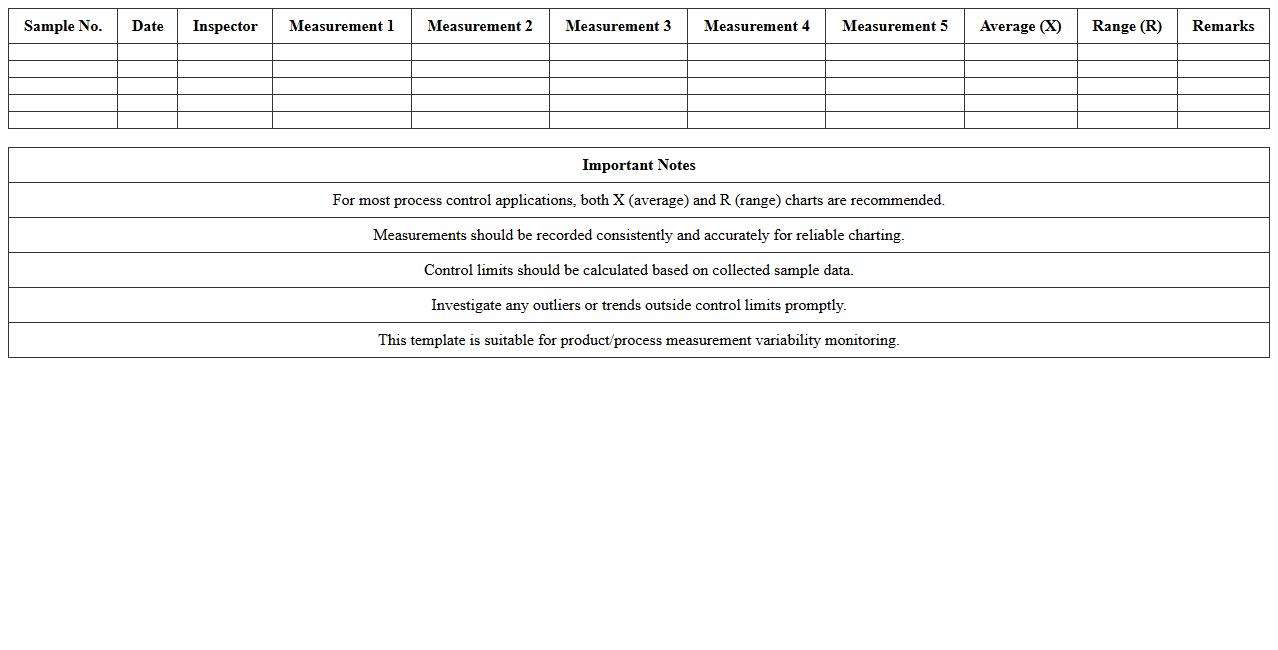
X-Bar and R Control Chart Excel Template for Manufacturing Quality
The
X-Bar and R Control Chart Excel Template for Manufacturing Quality is a specialized tool designed to monitor process stability and variability by plotting average values and ranges of sample data over time. It helps manufacturers detect shifts or trends in production processes, enabling early identification of potential quality issues before they escalate. This template streamlines data analysis, supports compliance with industry standards, and drives continuous improvement in product consistency and operational efficiency.
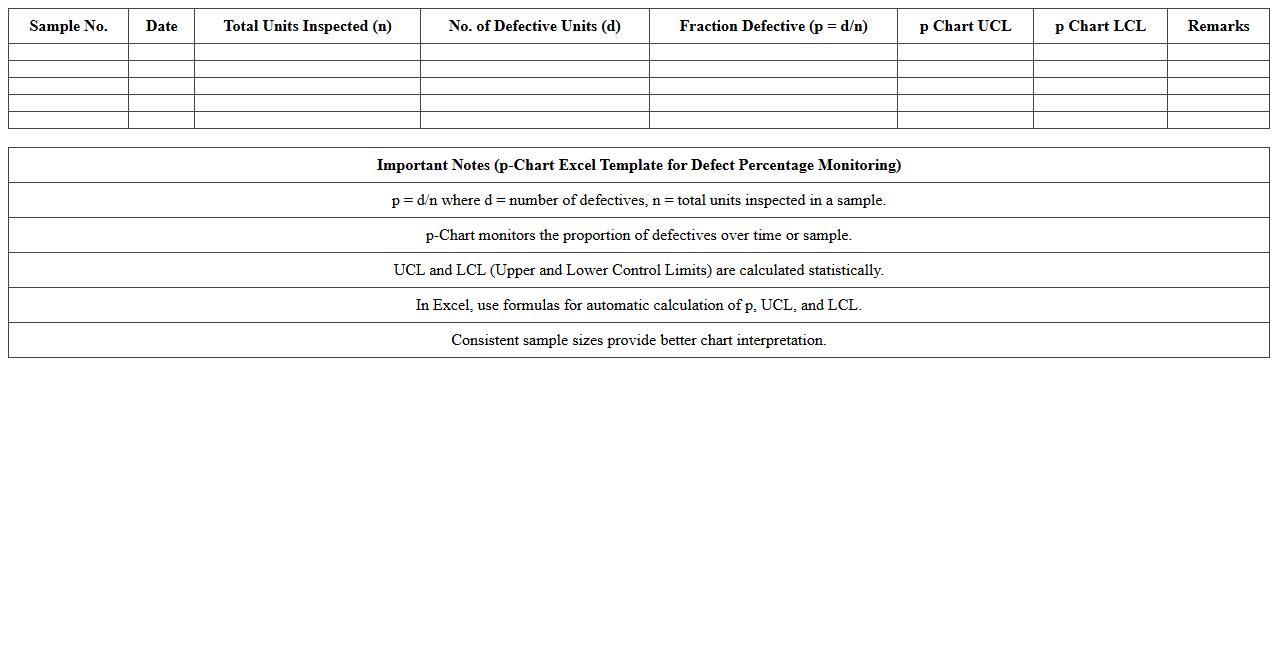
P-Chart Excel Template for Defect Percentage Monitoring
The
p-Chart Excel Template for Defect Percentage Monitoring document is a specialized tool designed to track and analyze the proportion of defective items in a production process over time. By visualizing defect percentages through control charts, it helps identify variations and trends, enabling early detection of process issues. This template is essential for improving quality control, reducing defects, and maintaining consistent product standards in manufacturing or service operations.
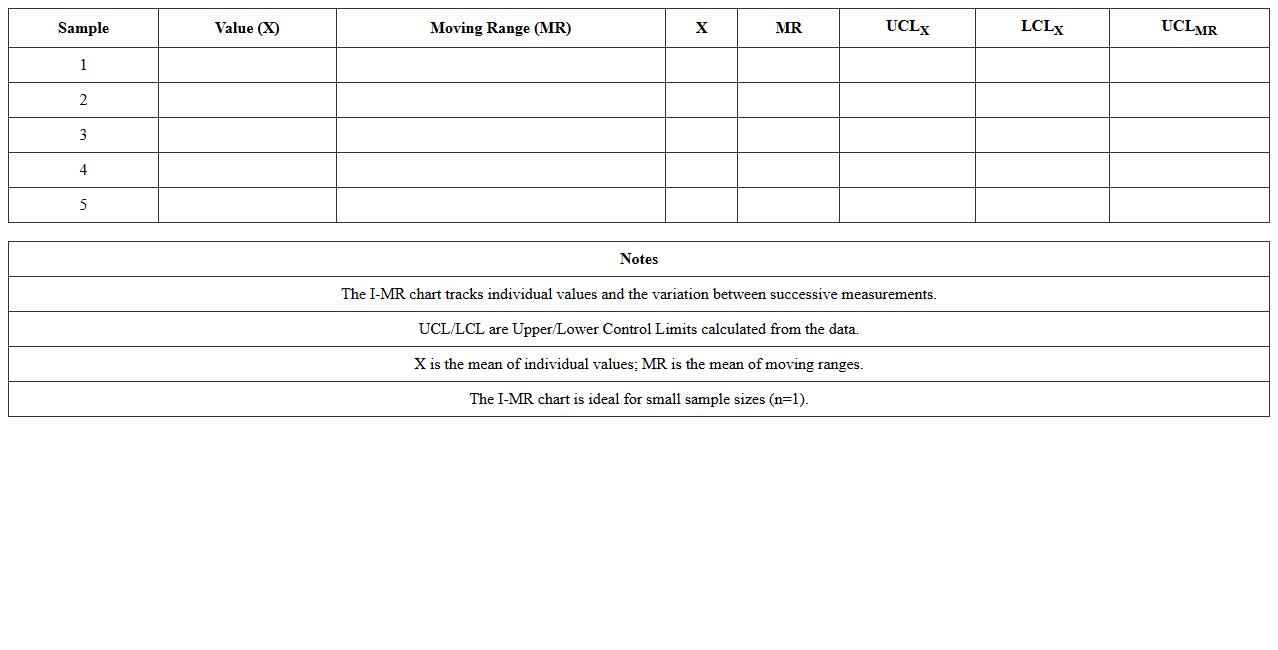
Individual-Moving Range (I-MR) Control Chart Excel Template
The
Individual-Moving Range (I-MR) Control Chart Excel Template document is a powerful tool designed to monitor process stability by tracking individual data points and their moving ranges over time. It enables users to identify variations and detect shifts or trends in processes, ensuring quality control and operational efficiency. This template simplifies data analysis by automating calculations and visualizing control limits, making it invaluable for continuous process improvement in manufacturing and service industries.
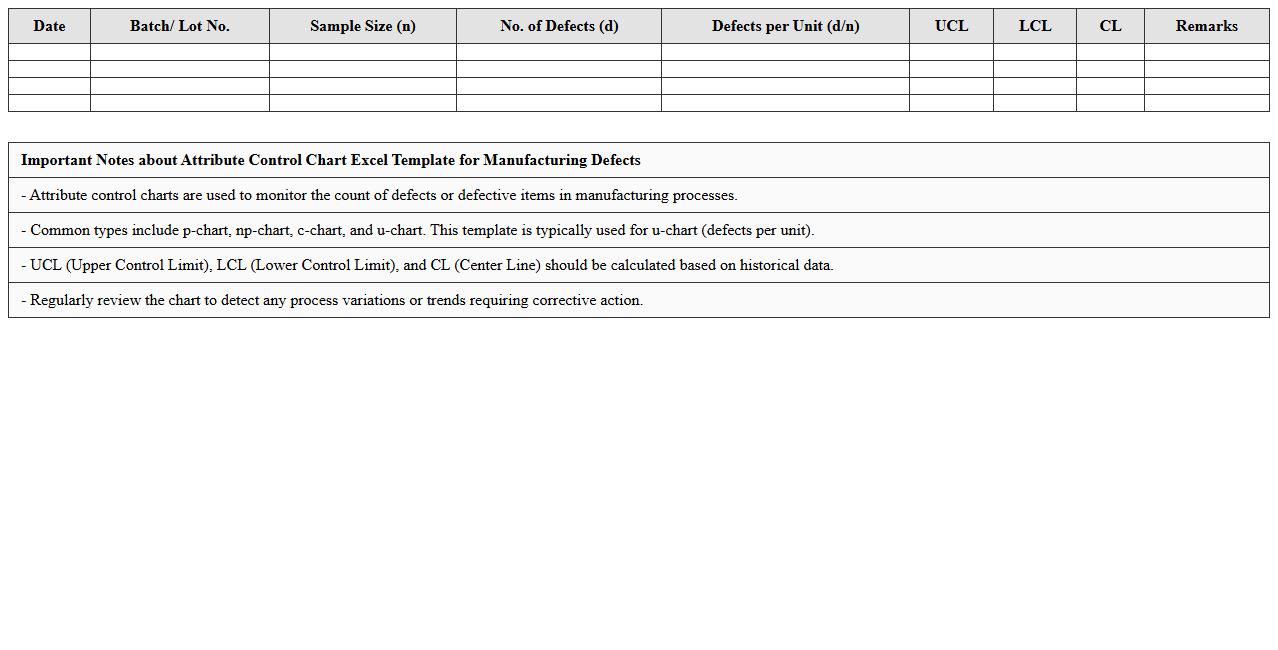
Attribute Control Chart Excel Template for Manufacturing Defects
The
Attribute Control Chart Excel Template for Manufacturing Defects is a specialized tool designed to monitor and analyze process quality by tracking the frequency of defects in production. This template enables manufacturers to visualize defect patterns over time, facilitating early detection of quality issues and helping maintain consistent product standards. Using this control chart improves decision-making in quality control processes, reduces waste, and enhances overall operational efficiency.
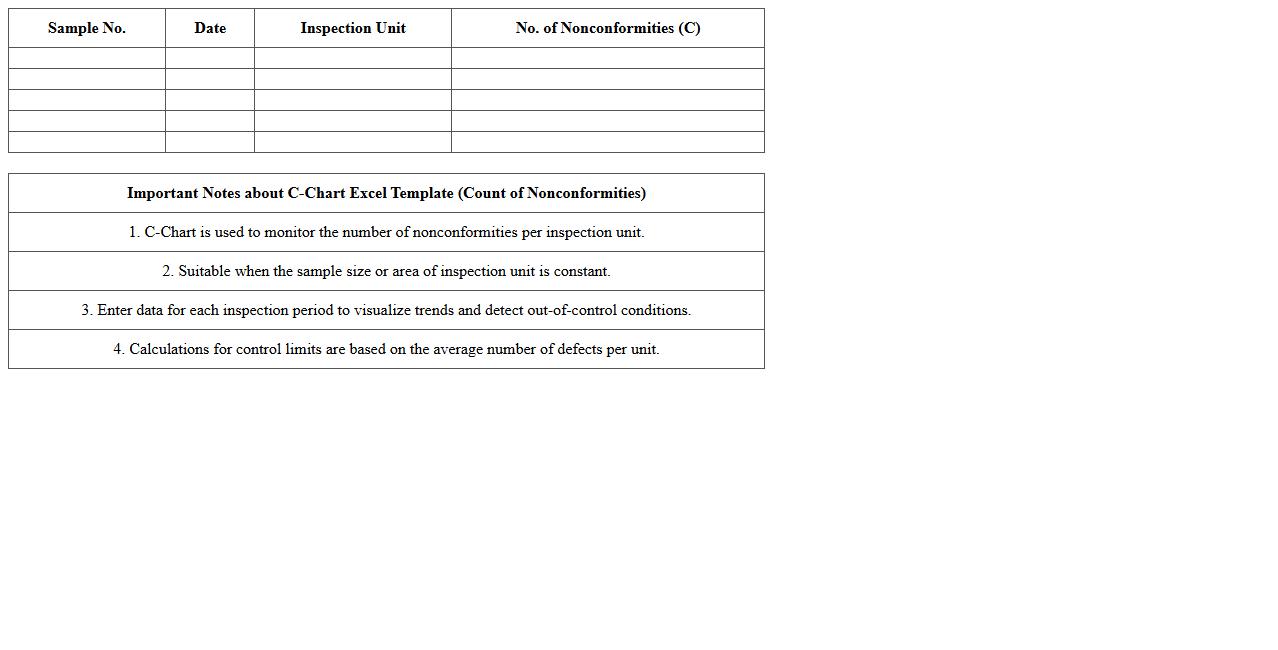
C-Chart Excel Template for Count of Nonconformities
The
C-Chart Excel Template for Count of Nonconformities document is a specialized statistical tool used to monitor the number of defects or nonconformities in a process over time. It helps businesses track variations in quality control by providing visual representations of data, enabling early detection of trends and abnormalities. This template enhances decision-making by simplifying data analysis and supporting continuous process improvement efforts.
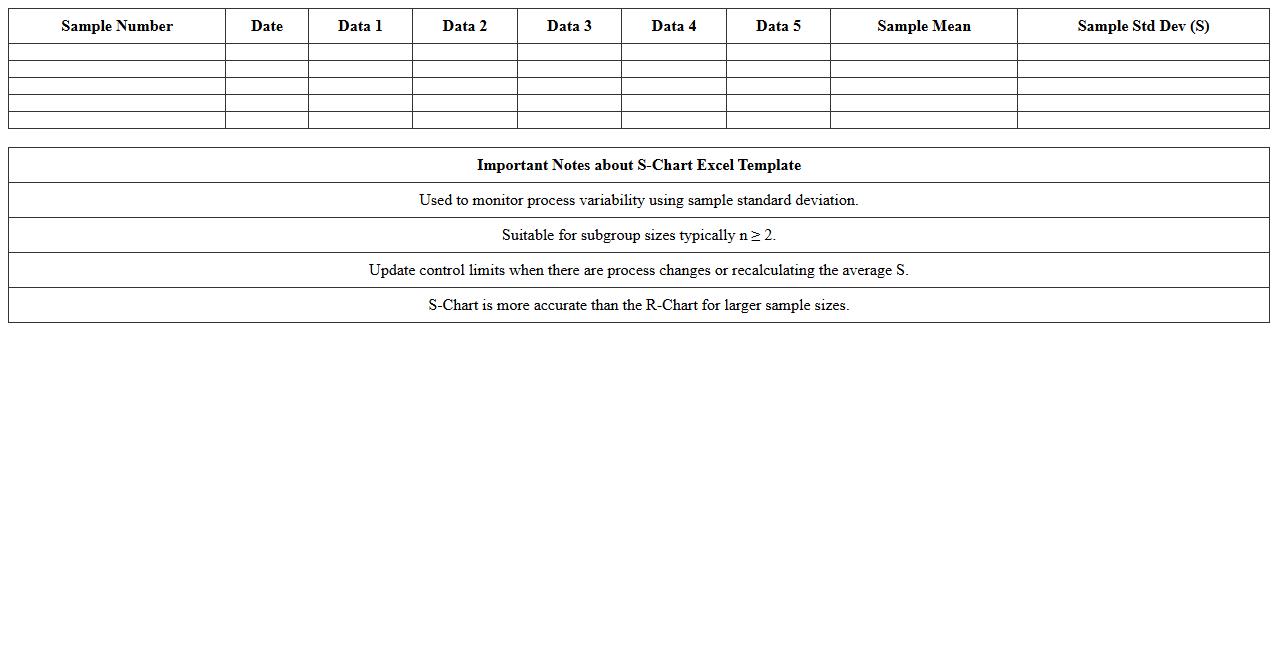
S-Chart Excel Template for Sample Standard Deviation Control
The
S-Chart Excel Template for Sample Standard Deviation Control is a statistical tool designed to monitor the variability within a process by tracking the standard deviation of samples over time. It helps identify fluctuations and trends that may indicate process instability, ensuring quality control in manufacturing or service environments. Using this template enables quick data input, automated calculations, and graphical visualization, making it easier to detect deviations and implement corrective actions promptly.
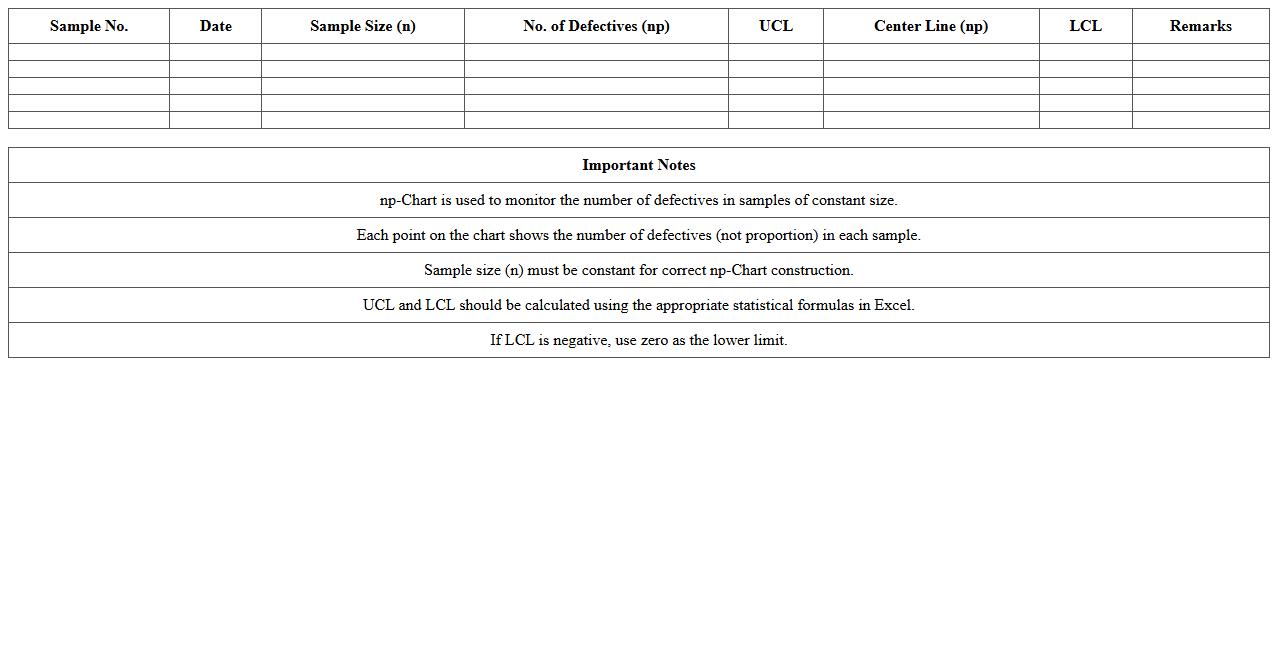
Np-Chart Excel Template for Number of Defectives
The
NP-Chart Excel Template for Number of Defectives document is a quality control tool designed to track and analyze the number of defective items in a production process over time. It visually represents data using control charts, helping identify trends, shifts, or unusual patterns that may indicate process issues. This template aids businesses in maintaining consistent product quality, reducing defects, and making informed decisions based on statistical process control methods.
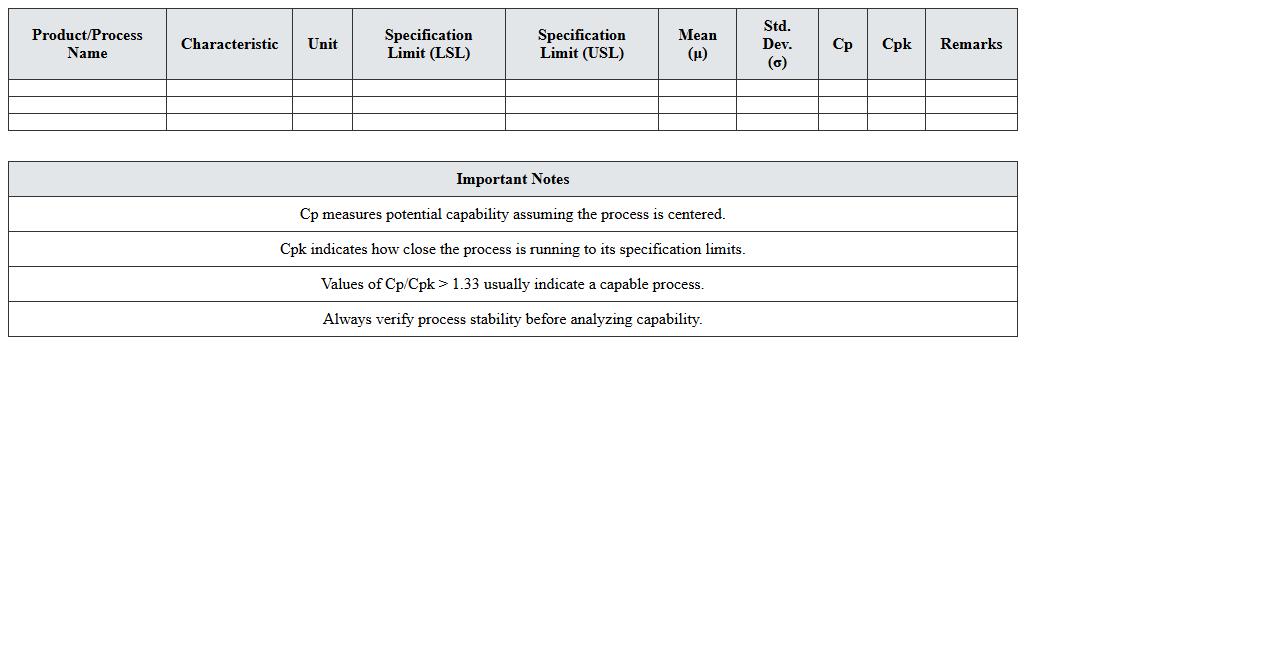
Process Capability Analysis Excel Template for Quality Control
Process Capability Analysis Excel Template is a
quality control tool designed to evaluate how well a manufacturing process meets specified limits through statistical metrics like Cp, Cpk, and Pp. It helps identify process variations, enabling data-driven decisions to improve product consistency and reduce defects. Utilizing this template streamlines data input and analysis, making it accessible for quality engineers and managers to monitor and enhance production performance efficiently.
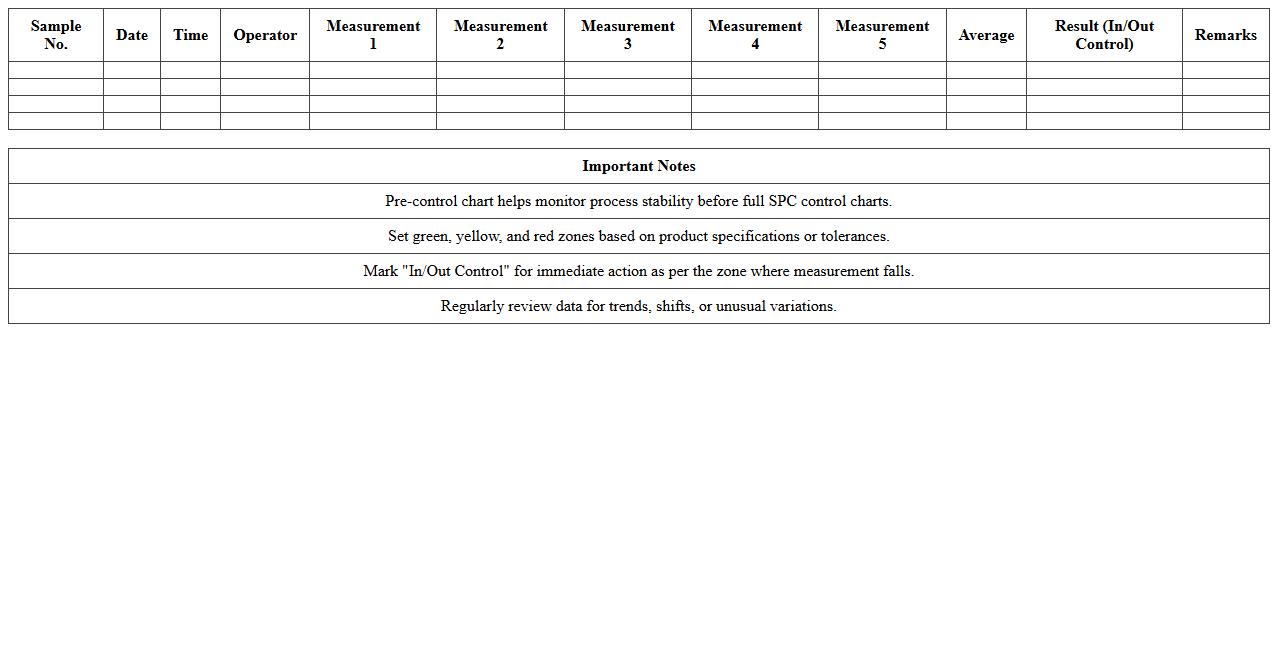
Pre-Control Chart Excel Template for Manufacturing Process Stability
The
Pre-Control Chart Excel Template for manufacturing process stability is a powerful statistical tool designed to monitor and control production processes by plotting key quality metrics against predefined control limits. This template enables manufacturers to detect variations early, ensuring that processes remain stable and within acceptable limits before producing defective products. Utilizing this document improves decision-making, reduces waste, and enhances overall product quality by providing clear, actionable insights into process performance.
Variable Control Chart Excel Template for Product Measurements
The
Variable Control Chart Excel Template for Product Measurements is a specialized tool designed to monitor and analyze product quality by tracking variations in measurable attributes over time. It helps identify trends, shifts, and anomalies in production processes, enabling manufacturers to maintain consistency and meet quality standards efficiently. Using this template enhances decision-making by providing clear, visual insights into process stability and control limits.
How to set up an X-bar and R control chart in Excel for monitoring process variation?
Begin by organizing your sample data in columns, separating subgroups for accurate analysis. Calculate the mean (X-bar) and range (R) for each subgroup to track process behavior. Use Excel's chart tools to plot these statistics, establishing control limits to monitor process variation effectively.
What Excel formulas automate control limit calculations for manufacturing quality data?
Utilize the AVERAGE and STDEV.S functions to determine central tendency and variability. Calculate Upper and Lower Control Limits using formulas such as UCL = X + A2*R and LCL = X - A2*R, where A2 is a constant based on subgroup size. These formulas help automate the computation of control limits for consistent quality monitoring.
How can Out-of-Control signals be visually flagged in a control chart spreadsheet?
Implement conditional formatting rules to highlight points outside control limits using distinct colors or icons. Use formulas like =OR(cell>UCL, cell to detect out-of-control signals. Visual cues enhance immediate identification of process abnormalities on the control chart.
Which Excel add-ins streamline multivariate control chart analysis for document letters?
Add-ins such as XLSTAT or Minitab Excel plugins provide advanced multivariate statistical tools to simplify control chart creation. These tools automate the calculation and visualization of complex correlations between variables for multivariate process control. Integrating these add-ins enhances analysis efficiency for document letter quality data.
How to update control charts automatically in Excel when new inspection data is logged?
Use Excel's dynamic tables or named ranges combined with the OFFSET and INDEX functions to create charts linked to data ranges. Incorporate VBA macros or Power Query to refresh control limits and charts upon data entry. This automation ensures current process monitoring without manual chart updates.
More Chart Excel Templates