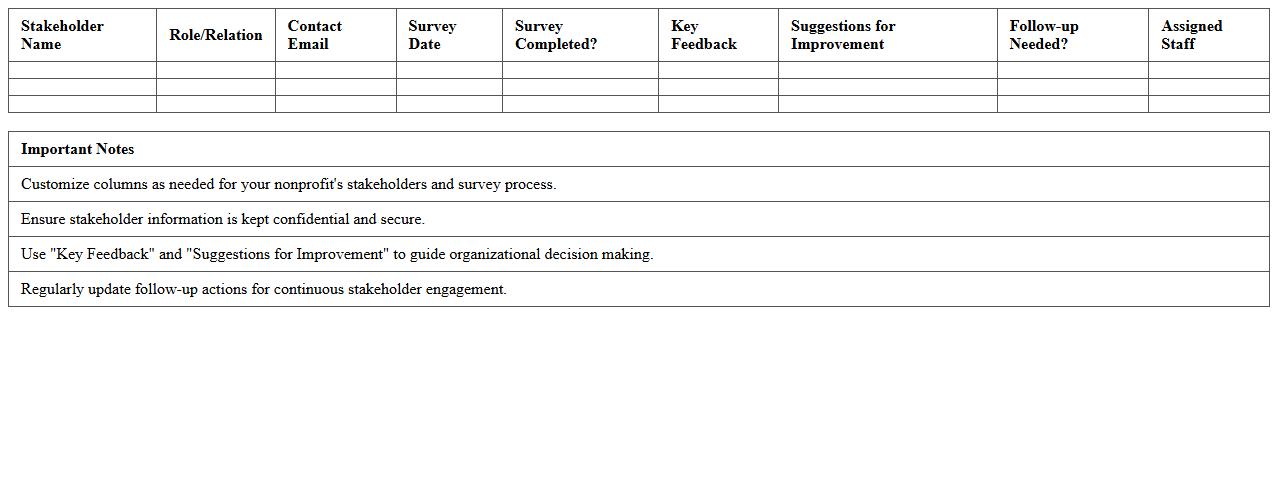
Stakeholder Survey Data Excel Template for Nonprofits
The
Stakeholder Survey Data Excel Template for Nonprofits is a structured spreadsheet designed to collect, organize, and analyze feedback from key stakeholders including donors, volunteers, beneficiaries, and staff. This document helps nonprofits track satisfaction levels, identify areas for improvement, and make data-driven decisions to enhance program effectiveness and stakeholder engagement. By consolidating survey results into a single, easy-to-navigate format, this template streamlines reporting and supports strategic planning efforts.
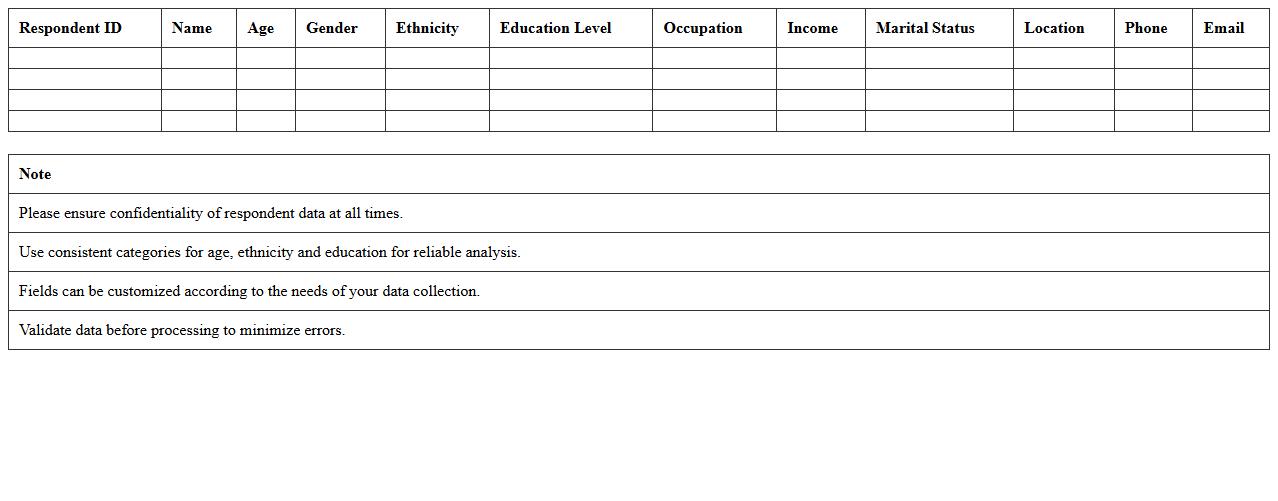
Demographic Data Collection Excel Template
A
Demographic Data Collection Excel Template is a structured spreadsheet designed to systematically gather and organize population-related information such as age, gender, income, education level, and geographic location. This template streamlines data entry and analysis, enabling efficient comparison and visualization of demographic trends for research, marketing, or policy planning. Utilizing this tool enhances accuracy, saves time, and supports informed decision-making based on detailed population insights.
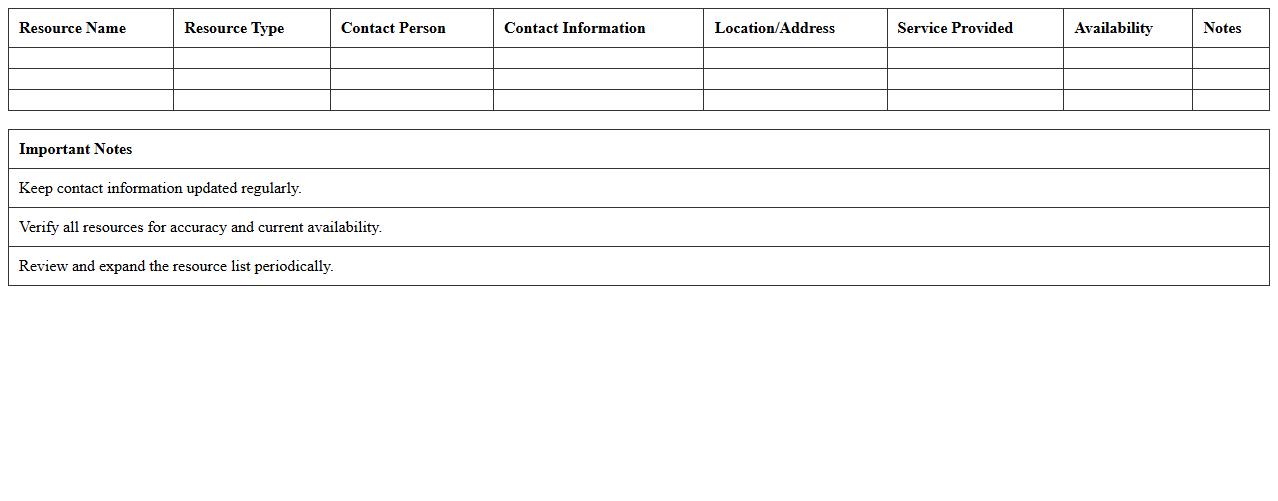
Community Resource Mapping Excel Template
The
Community Resource Mapping Excel Template document is a structured tool designed to catalog and analyze local assets, services, and organizations within a community. This template allows users to visually organize data such as health centers, educational institutions, and social services, which facilitates identifying gaps and opportunities for collaboration. Utilizing this resource enhances strategic planning, promotes efficient allocation of resources, and supports community development initiatives by providing a clear overview of available support systems.
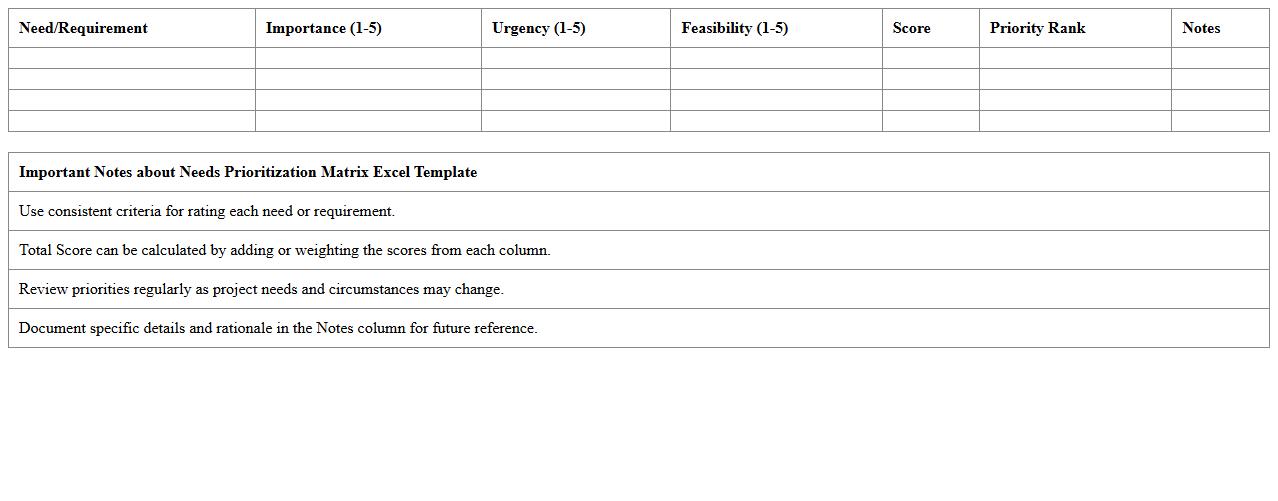
Needs Prioritization Matrix Excel Template
The
Needs Prioritization Matrix Excel Template is a structured tool designed to help individuals and teams systematically evaluate and rank various needs or projects based on predefined criteria such as urgency, impact, and cost. It simplifies decision-making by visually organizing priorities, allowing users to allocate resources effectively and focus on high-value tasks. This template enhances productivity and strategic planning by providing clear insights into which needs should be addressed first for optimal outcomes.
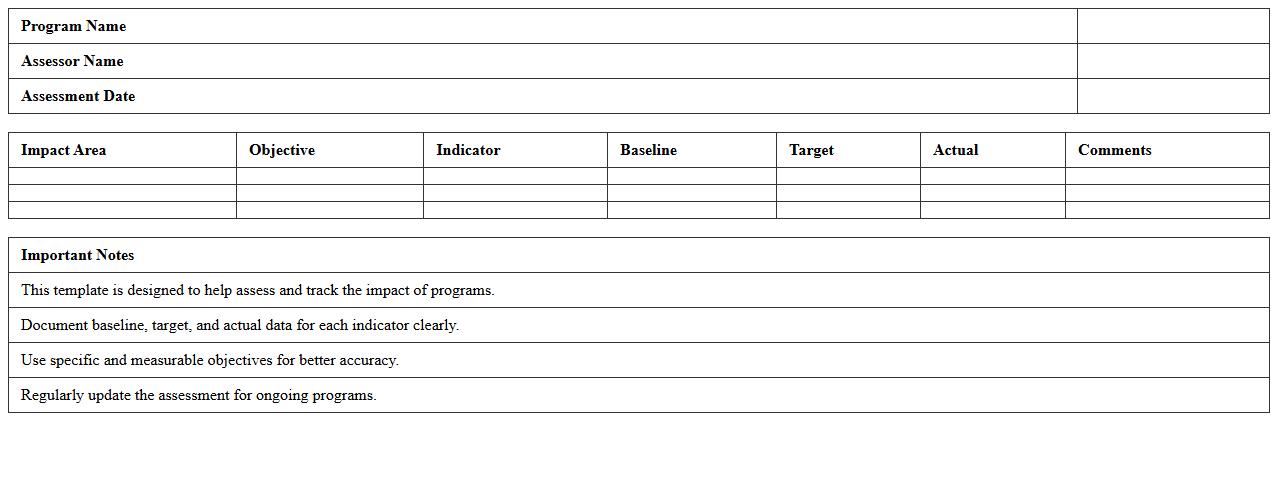
Program Impact Assessment Excel Template
The
Program Impact Assessment Excel Template document is a structured tool designed to measure and analyze the outcomes and effectiveness of various programs. It allows users to systematically input data, track key performance indicators, and visualize the impact through charts and graphs, facilitating data-driven decision-making. Organizations benefit from this template by improving accountability, enhancing reporting accuracy, and identifying areas for program improvement.
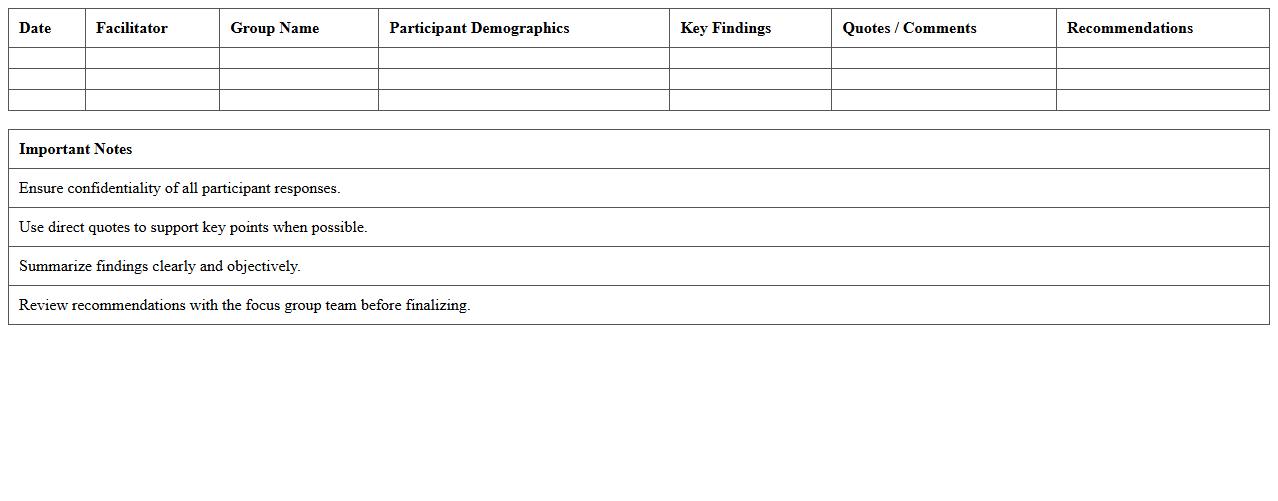
Focus Group Findings Excel Template
The
Focus Group Findings Excel Template document is a structured tool designed to organize and analyze qualitative data collected from focus group sessions efficiently. It allows users to systematically input participant feedback, categorize themes, and identify patterns, making data interpretation more accessible and actionable. This template enhances reporting accuracy, supports decision-making processes, and saves time by providing a clear framework for synthesizing group insights.
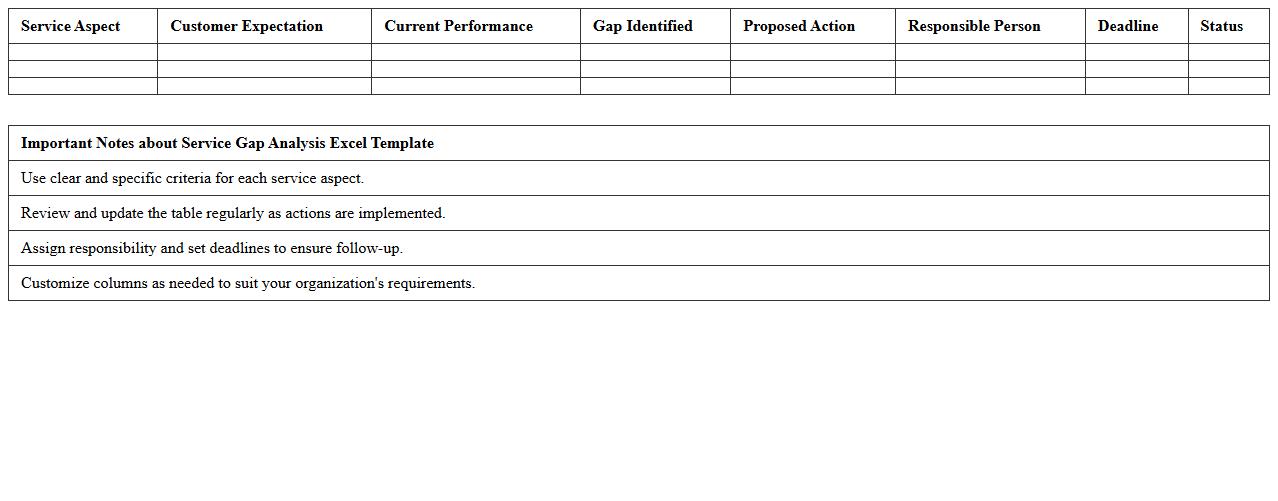
Service Gap Analysis Excel Template
A
Service Gap Analysis Excel Template document is a structured tool designed to identify discrepancies between expected and actual service performance by comparing customer expectations with service delivery metrics. It helps organizations pinpoint areas needing improvement, enabling targeted strategies to enhance customer satisfaction and operational efficiency. Using this template streamlines data collection and analysis, making gap identification more transparent and actionable for better service management.
Community Feedback Tracker Excel Template
The
Community Feedback Tracker Excel Template document is a structured tool designed to systematically collect, organize, and analyze feedback from community members. It helps project managers, local leaders, and organizations monitor community opinions, identify trends, and address concerns efficiently. Utilizing this template improves transparency, enhances decision-making, and fosters stronger community engagement by ensuring timely and accurate response to feedback.
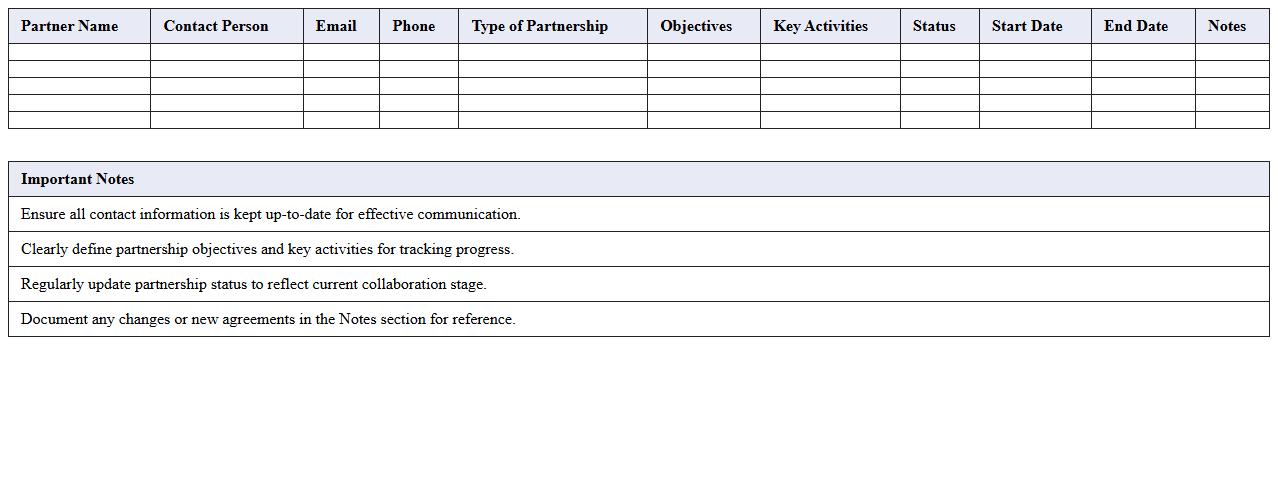
Partnership Mapping Excel Template
The
Partnership Mapping Excel Template document is a structured tool designed to visually organize and analyze relationships between various stakeholders and partners within a business or project ecosystem. It facilitates tracking partner roles, objectives, and contributions, enabling strategic decision-making and optimized collaboration efforts. Utilizing this template improves clarity in partnership dynamics, enhances communication, and supports effective resource allocation for achieving business goals.
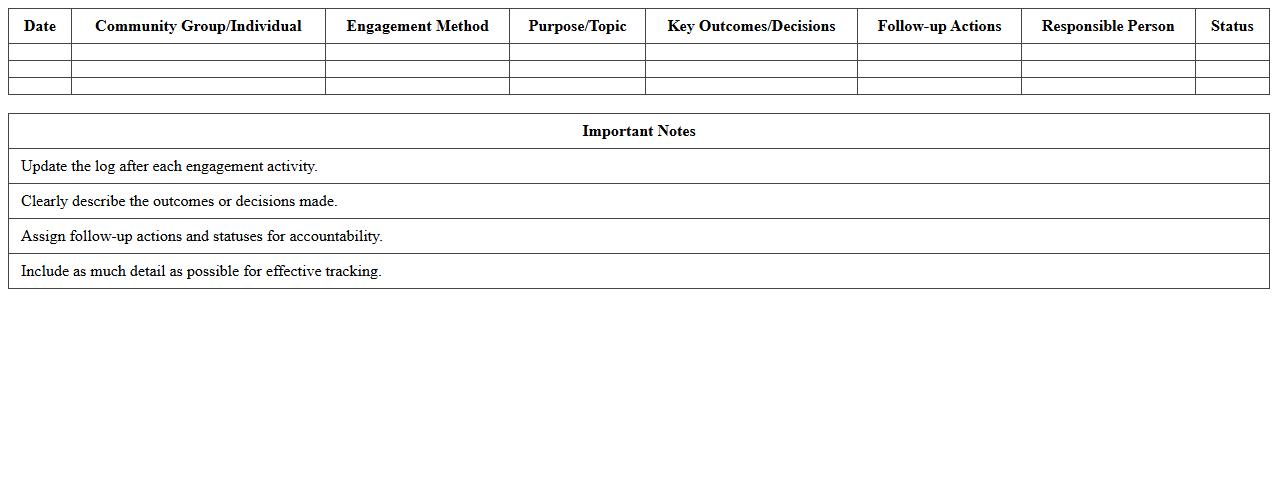
Community Engagement Log Excel Template
The
Community Engagement Log Excel Template document is a structured tool designed to track interactions, feedback, and participation within community projects or programs. It helps organizations systematically record dates, participant details, engagement types, and outcomes, enabling efficient monitoring and evaluation. This template improves communication transparency, supports data-driven decision making, and enhances overall community relationship management.
How do you structure Excel templates to prioritize urgent community needs identified in assessments?
To structure Excel templates for prioritizing urgent community needs, start by creating separate tabs for data input, scoring, and prioritized results. Use columns for need descriptions, impact scores, and urgency ratings to quantify each need systematically. Implement conditional formatting to easily visualize and highlight the most critical needs based on scoring.
What key data columns are essential for tracking community input in nonprofit needs assessments?
Essential data columns include respondent identifiers, geographic location, and type of community need expressed. Include columns for feedback format such as comments, rating scales, or quantitative responses to capture diverse input. Tracking date of response and demographic details helps ensure the data reflects a comprehensive community perspective.
How do you automate scoring and ranking of needs in an Excel-based community assessment?
Automate scoring by using Excel formulas like SUMPRODUCT or weighted averages to calculate total need scores based on criteria such as urgency and impact. Create dynamic ranking by implementing the RANK.EQ function to order needs from highest to lowest score. Use data validation and drop-down lists to maintain consistency and reduce errors in scoring inputs.
Which Excel visualization tools best highlight service gaps revealed by assessment data?
PivotTables combined with PivotCharts effectively summarize and visualize key metrics to identify service gaps highlighted in the data. Conditional formatting with data bars or color scales helps spotlight areas with high unmet needs instantly. Additionally, map charts can geographically display service voids for a compelling visual representation of community disparities.
How do you securely manage sensitive demographic information in Excel for nonprofit assessments?
Secure sensitive demographic data by applying password protection to workbooks and restricting worksheet access with permissions. Remove identifiable personal information when possible and use data encryption features to protect the file from unauthorized access. Regularly back up files and implement strict data governance protocols to ensure compliance with privacy regulations.