The Financial Ratio Analysis Excel Template for SaaS Startups provides a streamlined way to evaluate key performance metrics such as customer acquisition cost, churn rate, and monthly recurring revenue. It enables SaaS founders to monitor growth, profitability, and liquidity through customizable ratio calculations tailored to subscription-based business models. This tool enhances financial decision-making by offering clear visuals and detailed insights into the startup's financial health.
SaaS Startup Financial Ratio Dashboard Excel Template
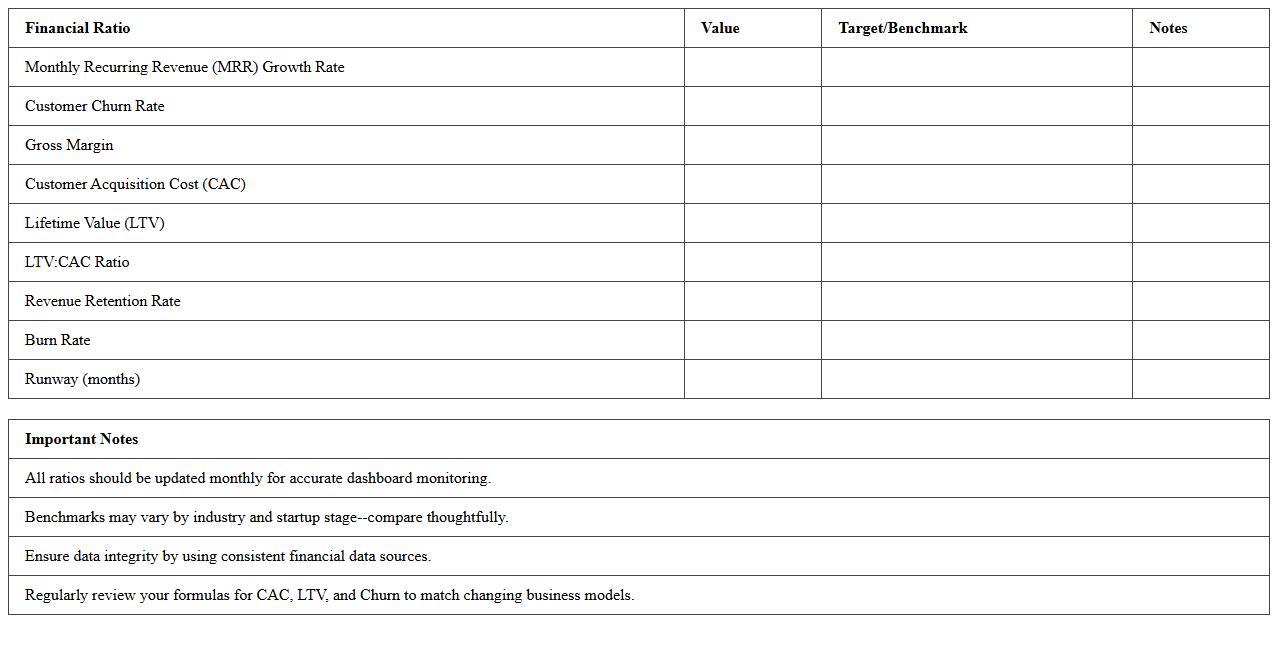
The
SaaS Startup Financial Ratio Dashboard Excel Template is a comprehensive tool designed to track and analyze key financial metrics specific to Software as a Service startups. It consolidates ratios such as churn rate, customer acquisition cost, and monthly recurring revenue into an easily interpretable dashboard, enabling data-driven decision-making. This template helps investors and founders monitor business health, optimize growth strategies, and manage cash flow effectively.
SaaS Gross Margin Analysis Excel Spreadsheet
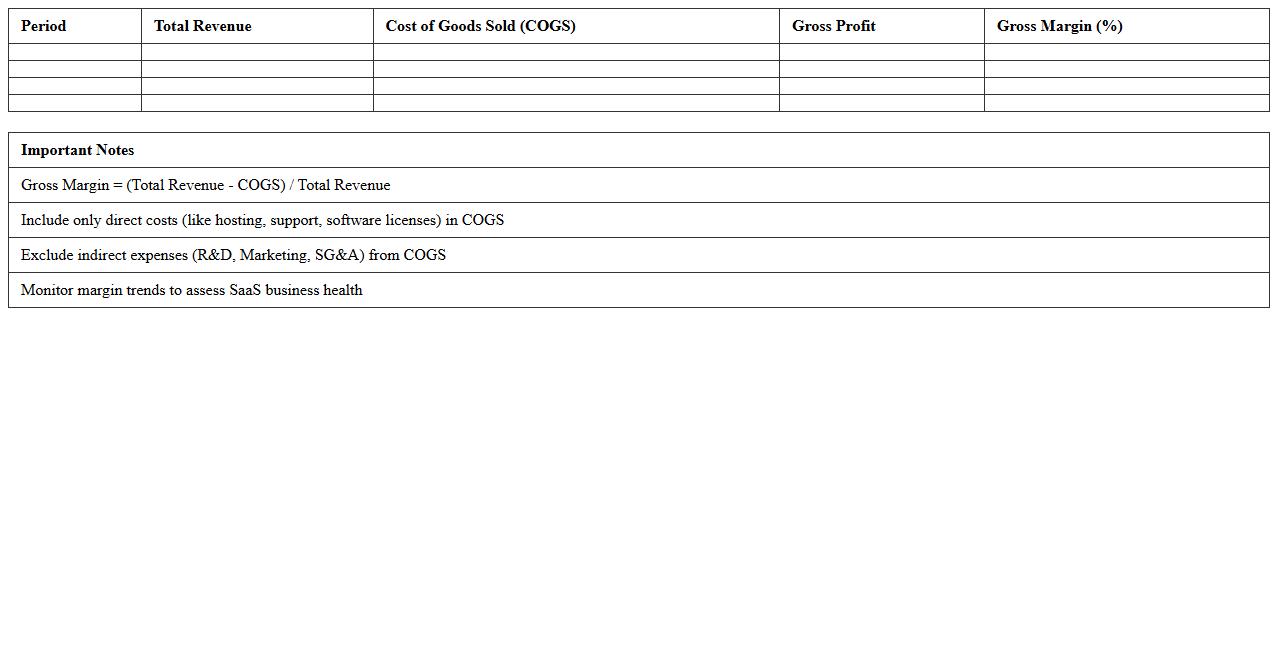
A
SaaS Gross Margin Analysis Excel Spreadsheet is a financial tool designed to calculate and visualize the profitability of Software as a Service businesses by tracking revenue and direct costs associated with service delivery. This spreadsheet helps identify revenue growth opportunities, optimize cost structures, and improve decision-making through detailed margin breakdowns over time. It is essential for SaaS companies aiming to maintain sustainable profitability and enhance operational efficiency.
SaaS Quick Ratio & Burn Rate Tracker Template
The
SaaS Quick Ratio & Burn Rate Tracker Template document is a financial tool designed to measure a company's efficiency in balancing customer acquisition and revenue growth against cash burn. It helps SaaS businesses monitor their monthly recurring revenue growth relative to churn and operating expenses, enabling data-driven decisions to optimize profitability and sustainability. By providing real-time insights into the quick ratio and burn rate, it supports effective cash flow management and strategic planning.
SaaS Churn & Retention Ratio Calculator Sheet
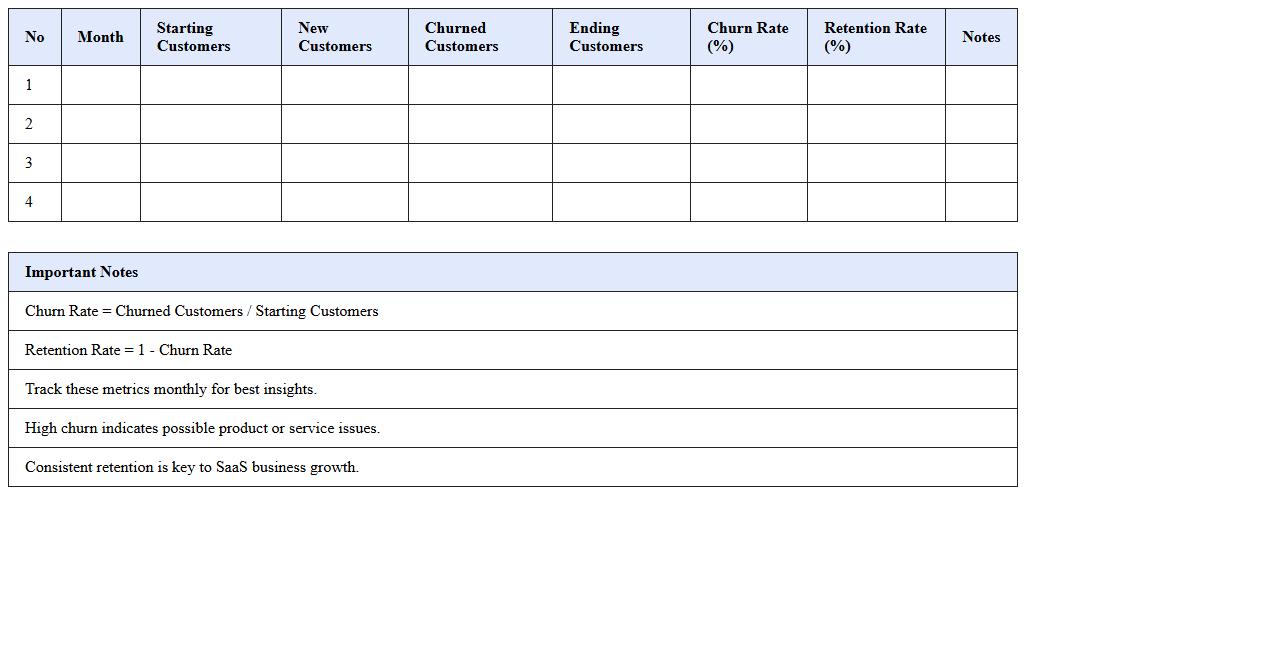
The
SaaS Churn & Retention Ratio Calculator Sheet is a spreadsheet tool designed to accurately measure customer churn rate and retention ratios for Software as a Service businesses. It helps track subscriber loss and gain over time, providing critical insights into customer behavior and business growth sustainability. Using this calculator enables companies to make data-driven decisions for improving customer retention strategies and forecasting revenue more effectively.
SaaS CAC to LTV Ratio Analysis Excel
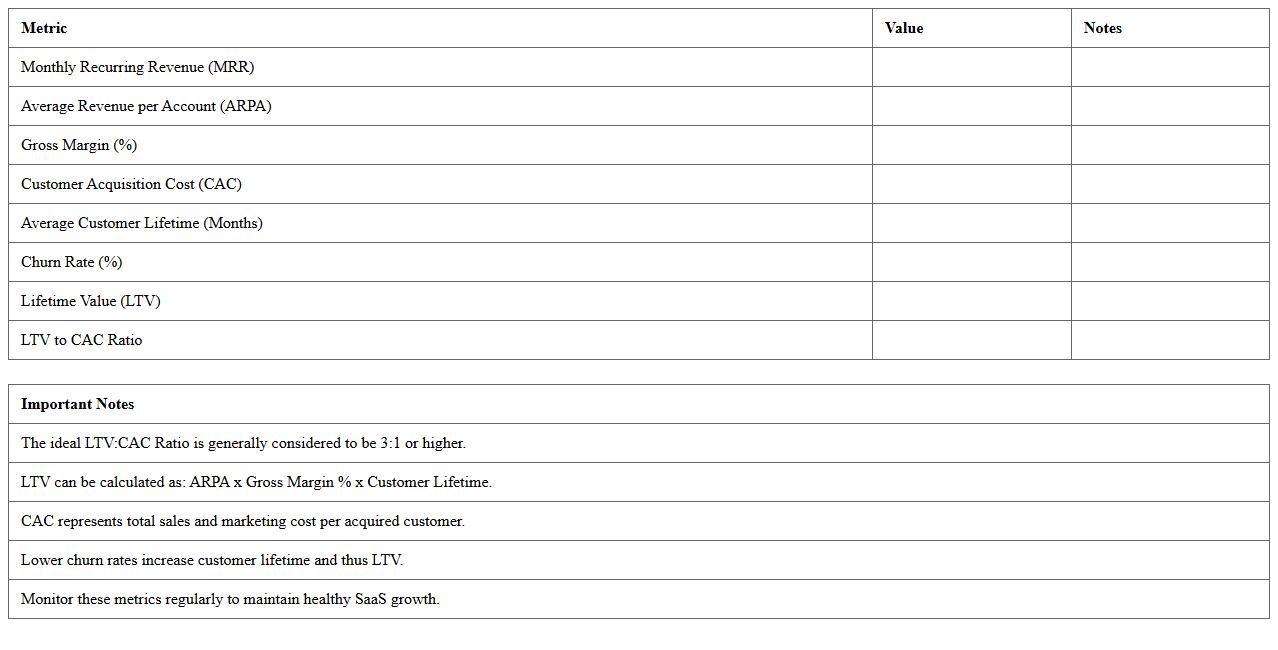
A
SaaS CAC to LTV Ratio Analysis Excel document calculates and compares the Customer Acquisition Cost (CAC) against the Lifetime Value (LTV) of customers to evaluate business profitability in subscription models. This analysis helps identify whether the spending on acquiring new customers is justified by the revenue they generate over time, guiding strategic decisions on marketing investments and pricing. Using this Excel tool enables efficient tracking and visualization of key metrics, facilitating data-driven growth strategies for SaaS companies.
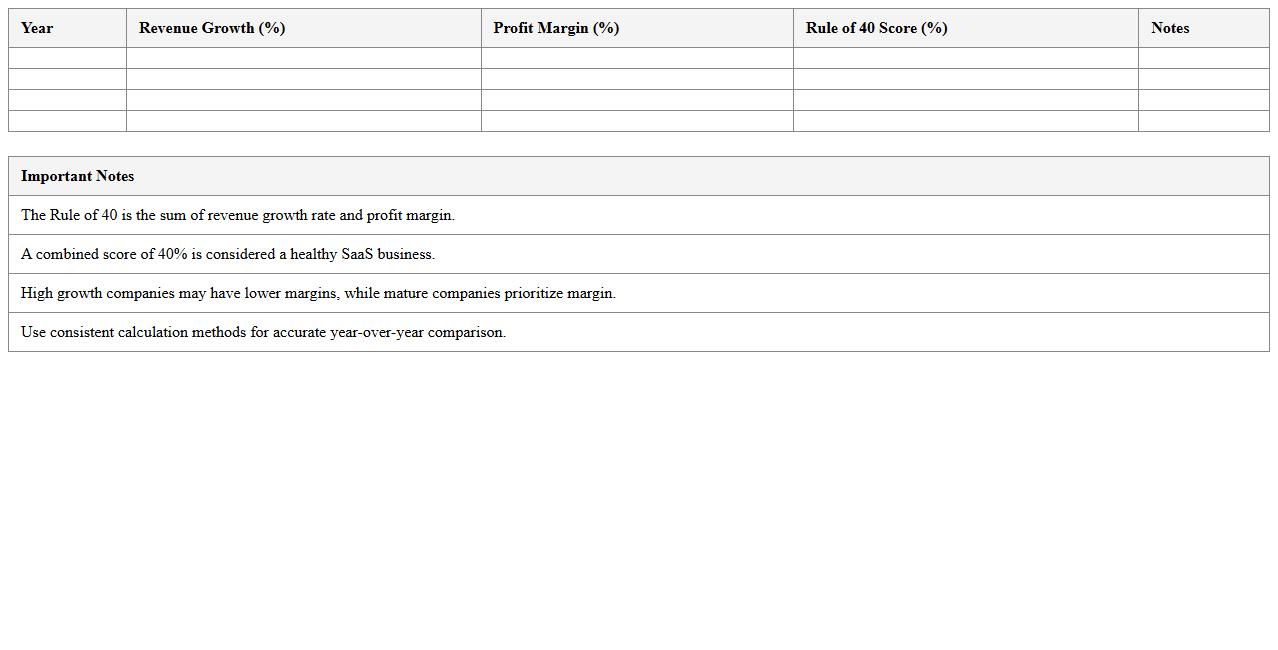
SaaS Rule of 40 Performance Ratio Template
The
SaaS Rule of 40 Performance Ratio Template document serves as a critical financial benchmark combining growth rate and profitability metrics for Software as a Service companies. It helps businesses evaluate whether their growth and profit margins align with industry standards to ensure sustainable expansion. By using this template, organizations can make data-driven decisions to balance investment in growth with operational efficiency.
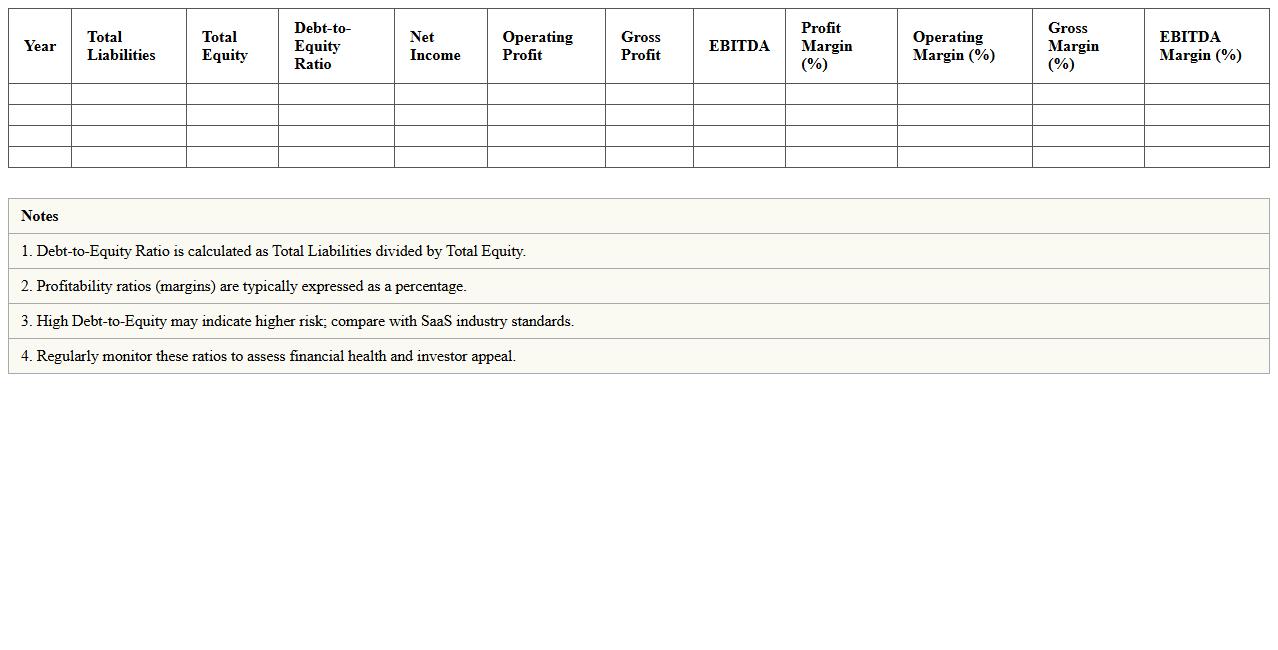
SaaS Debt-to-Equity and Profitability Ratio Sheet
The
SaaS Debt-to-Equity and Profitability Ratio Sheet document provides a detailed financial analysis by comparing a company's debt levels to its equity and assessing its profitability metrics. This sheet is essential for SaaS businesses to evaluate financial stability, manage risk, and make informed decisions about investments or operational improvements. It helps stakeholders identify financial health trends, optimize capital structure, and enhance overall business sustainability.
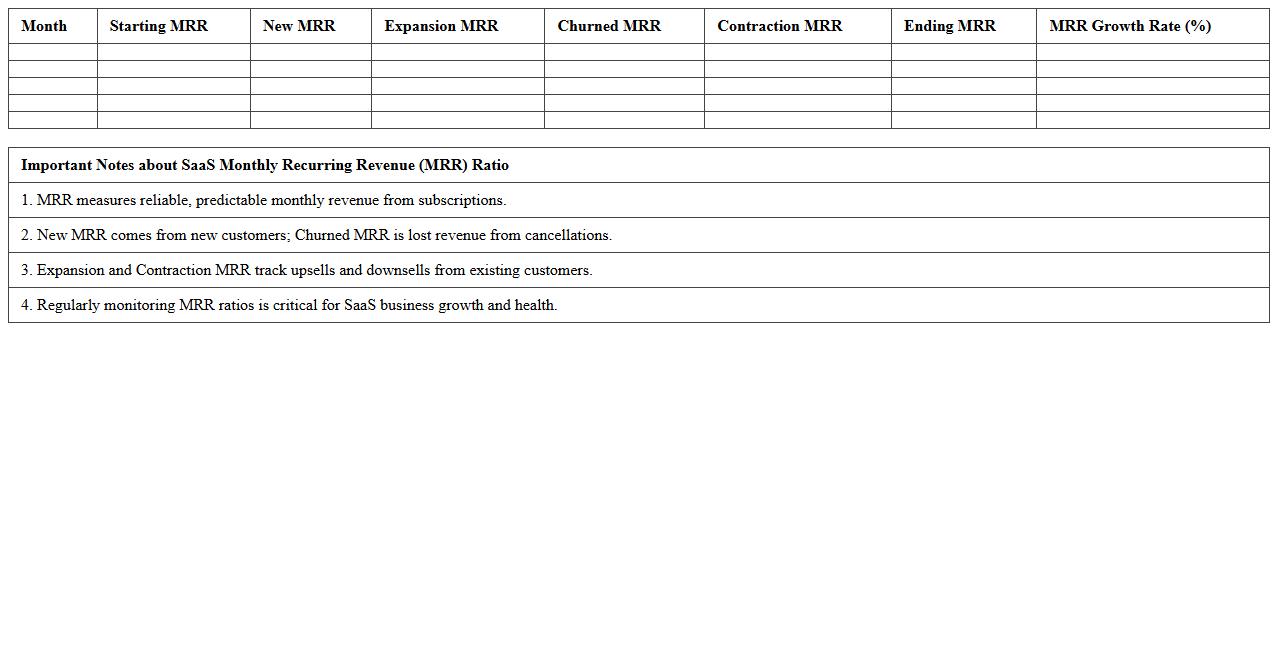
SaaS Monthly Recurring Revenue (MRR) Ratio Excel
The
SaaS Monthly Recurring Revenue (MRR) Ratio Excel document is a powerful tool designed to track and analyze the growth and stability of subscription-based income for SaaS businesses. It allows users to calculate essential metrics such as churn rate, expansion MRR, and net new MRR, providing clear insights into revenue trends and customer retention. By leveraging this document, companies can make informed decisions to optimize pricing strategies, improve forecasting accuracy, and enhance overall financial health.
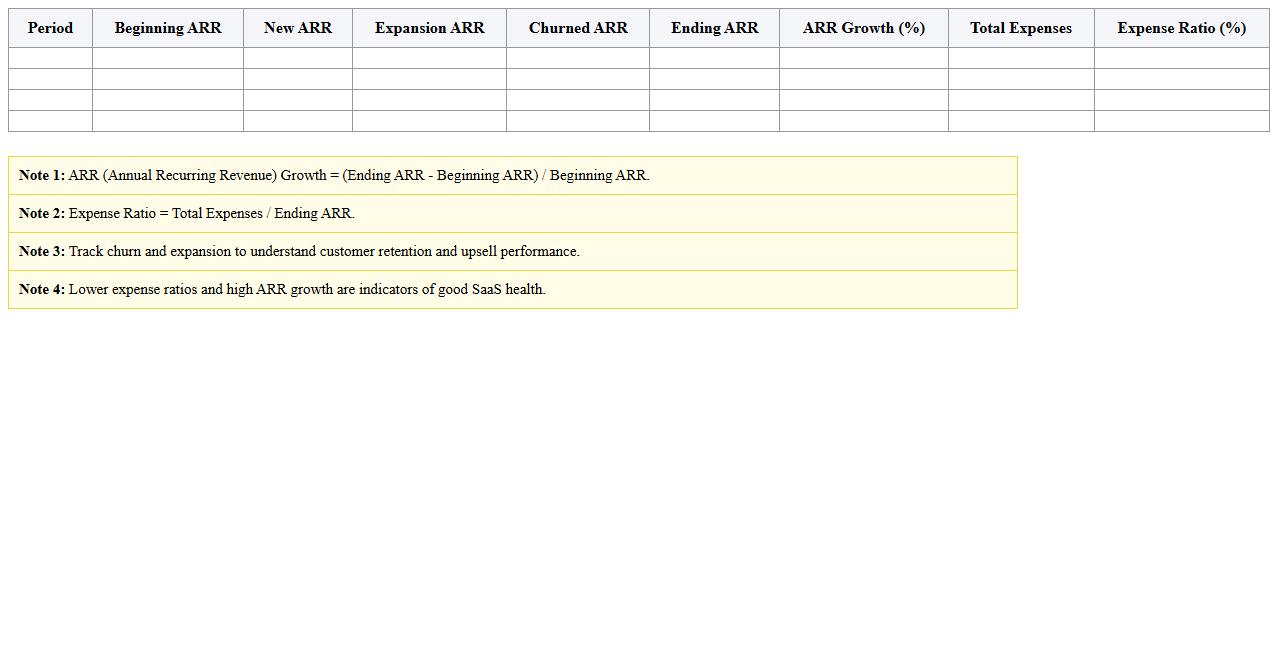
SaaS ARR Growth and Expense Ratio Template
The
SaaS ARR Growth and Expense Ratio Template document is a specialized financial tool designed to track Annual Recurring Revenue (ARR) growth alongside key expense ratios within a SaaS business model. This template helps companies analyze revenue expansion in relation to operational costs, enabling strategic decision-making and resource allocation for sustainable growth. By providing clear insights into profitability and cost efficiency, it supports optimizing financial performance and forecasting future business outcomes.
SaaS Efficiency Score Financial Ratio Analysis Sheet
The
SaaS Efficiency Score Financial Ratio Analysis Sheet is a critical document that evaluates key financial ratios specifically tailored for Software as a Service (SaaS) businesses, helping to measure operational efficiency and profitability. It consolidates data such as customer acquisition cost, lifetime value, churn rate, and revenue growth to provide actionable insights for optimizing financial performance. This analysis enables stakeholders to make informed decisions, improve resource allocation, and drive sustainable business growth.
How do you automate cohort analysis for MRR retention in an Excel template?
To automate cohort analysis for MRR retention, start by organizing customers into acquisition cohorts by month or quarter. Use Excel formulas like SUMIFS and INDEX-MATCH to aggregate MRR within each cohort over specific retention periods. Incorporate dynamic arrays or pivot tables to refresh results automatically as new data is added.
What are the best Excel formulas for tracking SaaS gross margin trends monthly?
The gross margin trend can be tracked monthly using formulas such as (Revenue - Cost of Goods Sold) / Revenue. Use SUMIFS to sum revenue and costs for each month dynamically. Complement these with AVERAGEIFS and SPARKLINE functions for trend visualization directly within cells.
How can you visualize LTV:CAC ratio dynamically in Excel dashboards?
To visualize the LTV:CAC ratio dynamically, create calculated columns for Lifetime Value (LTV) and Customer Acquisition Cost (CAC) using relevant inputs. Implement Excel charts like line or bar graphs linked to these calculations for instant updates. Include slicers or drop-down filters to interactively adjust dashboard views by period or customer segment.
Which Excel KPIs are crucial for monitoring SaaS runway based on financial ratios?
Key Excel KPIs for SaaS runway include burn rate, MRR growth rate, gross margin, and cash runway duration. Use formulas such as AVERAGE for burn rate and YEARFRAC to forecast runway months left. Visualizing these via conditional formatting helps highlight runway risks early.
How do you link deferred revenue schedules to real-time ratio analysis in Excel?
Link deferred revenue schedules with real-time ratio analysis by maintaining a detailed deferred revenue table with billing and recognition dates. Use VLOOKUP or XLOOKUP to dynamically pull recognized revenue into financial ratio calculations. Refreshing linked data tables ensures the ratios reflect up-to-date revenue recognition status.
More Analysis Excel Templates