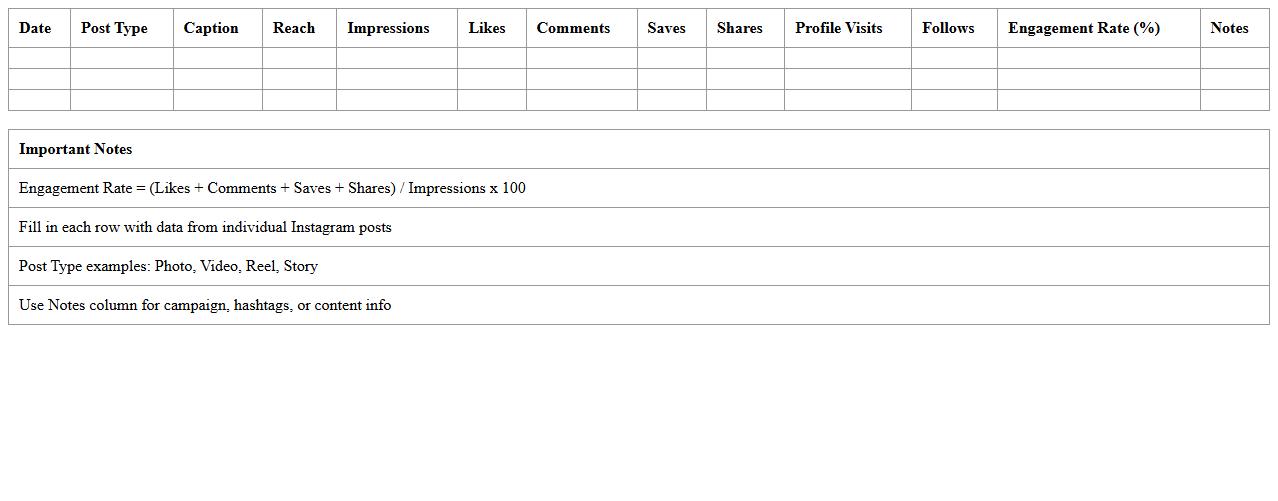
Instagram Engagement Analytics Excel Template
The
Instagram Engagement Analytics Excel Template document is a structured spreadsheet designed to track and analyze key engagement metrics such as likes, comments, shares, and follower growth on Instagram posts. It helps users visualize trends, identify the best-performing content, and make data-driven decisions to improve social media strategies. By organizing complex data into clear graphs and tables, this template enhances efficiency and supports optimized content planning.
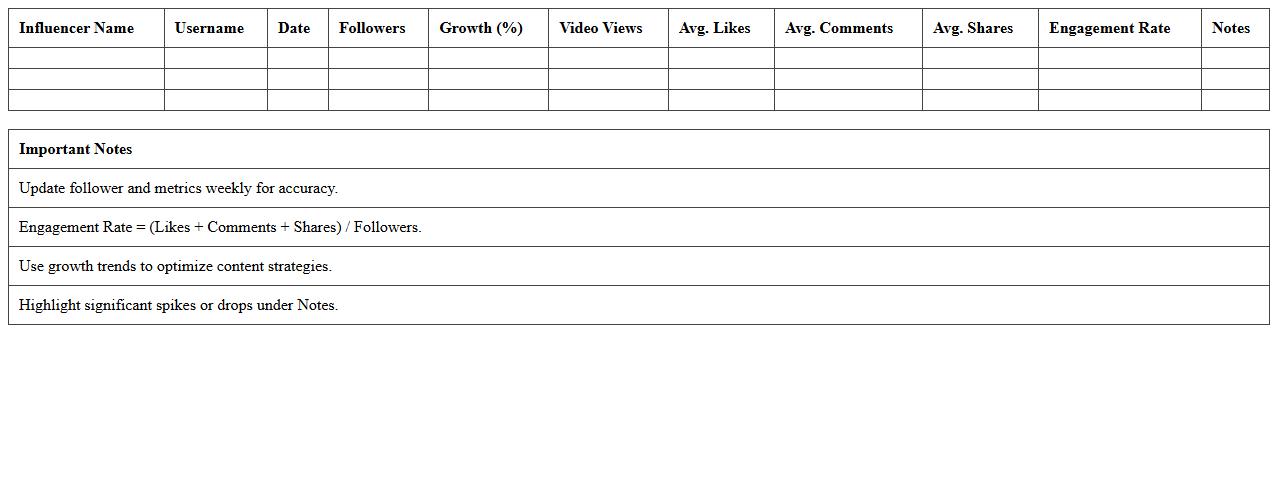
YouTube Channel Performance Tracker Excel
The
YouTube Channel Performance Tracker Excel is a tool designed to monitor and analyze key metrics such as views, watch time, subscriber growth, and engagement rates over time. This document enables creators to identify trends, understand audience behavior, and optimize content strategies effectively. By providing a clear visual representation of performance data, it supports informed decision-making to enhance channel growth and maximize reach.
TikTok Influencer Growth Report Template
The
TikTok Influencer Growth Report Template document provides a structured format to track and analyze the performance metrics of TikTok influencers, including follower growth, engagement rates, and content reach. It helps marketers and social media managers measure the effectiveness of influencer campaigns and optimize strategies based on real-time data. Using this template ensures consistent reporting, making it easier to identify trends and make informed decisions for improving influencer partnerships.
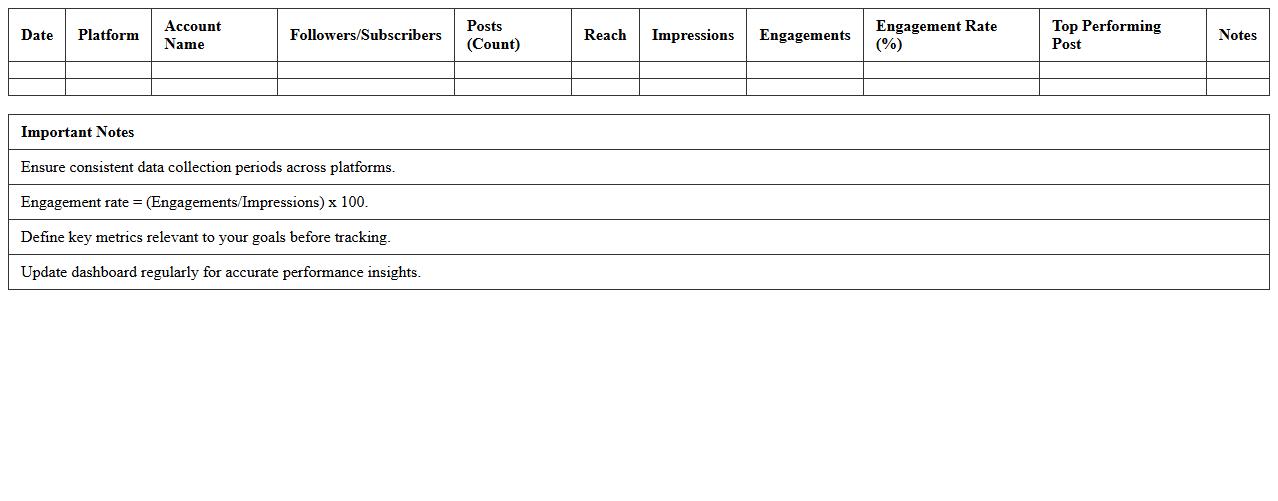
Cross-Platform Social Media Metrics Dashboard Excel
A
Cross-Platform Social Media Metrics Dashboard Excel document consolidates data from various social media channels into a single, easy-to-analyze interface, enabling users to track engagement, reach, and performance across platforms. It helps marketers and social media managers quickly identify trends, compare metrics such as likes, shares, comments, and follower growth, and make data-driven decisions to optimize content strategies. This tool saves time by automating data aggregation and visualization, improving the accuracy and efficiency of social media reporting.
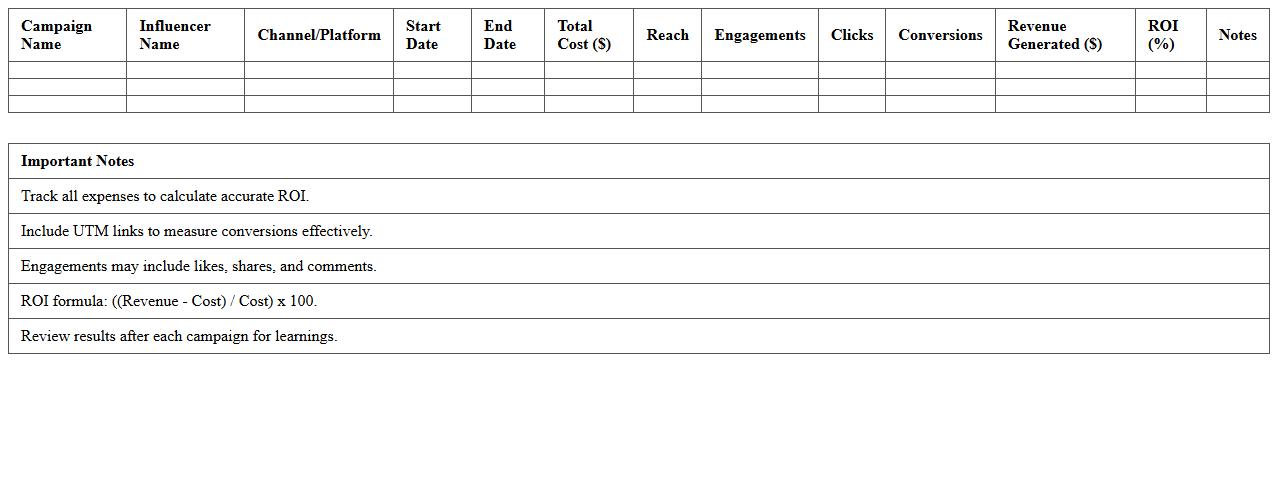
Influencer Campaign ROI Analytics Excel Sheet
The
Influencer Campaign ROI Analytics Excel Sheet is a powerful tool designed to track and measure the return on investment from influencer marketing efforts by analyzing metrics such as engagement rates, conversion rates, and cost per acquisition. This document helps businesses quantify the effectiveness of influencer collaborations, enabling data-driven decisions to optimize budget allocation and campaign strategies. By consolidating performance data into an easy-to-use spreadsheet, it streamlines the process of evaluating campaign success and identifying high-impact influencers.
Monthly Follower Growth Tracking Excel Template
The
Monthly Follower Growth Tracking Excel Template is a structured tool designed to monitor and analyze changes in social media follower counts over time. It enables users to visualize trends, measure engagement success, and identify growth patterns by organizing data into easily interpretable charts and tables. This template is essential for marketers and content creators aiming to optimize their social media strategy through data-driven insights.
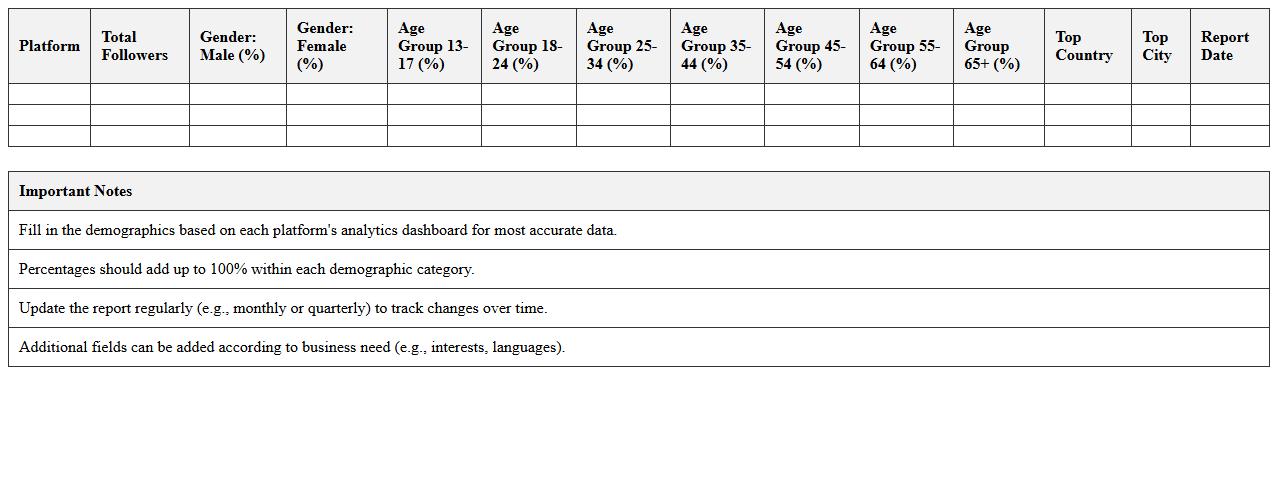
Social Media Audience Demographics Report Excel
A
Social Media Audience Demographics Report Excel document organizes detailed data on the age, gender, location, interests, and behavior of social media users interacting with a brand or campaign. This report helps marketers and analysts understand their audience composition, enabling targeted content creation and optimized advertising strategies. By leveraging this demographic insight, businesses can improve engagement, increase conversion rates, and allocate budget more efficiently across platforms.
Influencer Post Reach & Impressions Tracker Excel
The
Influencer Post Reach & Impressions Tracker Excel document is a powerful tool designed to monitor and analyze the performance metrics of influencer marketing campaigns, specifically focusing on post reach and impressions. It allows users to systematically record data such as audience engagement, reach growth, and impression counts, providing clear insights into campaign effectiveness and ROI. Marketers and brand managers can leverage this tracker to optimize strategy, allocate budgets smarter, and enhance overall influencer collaboration outcomes.
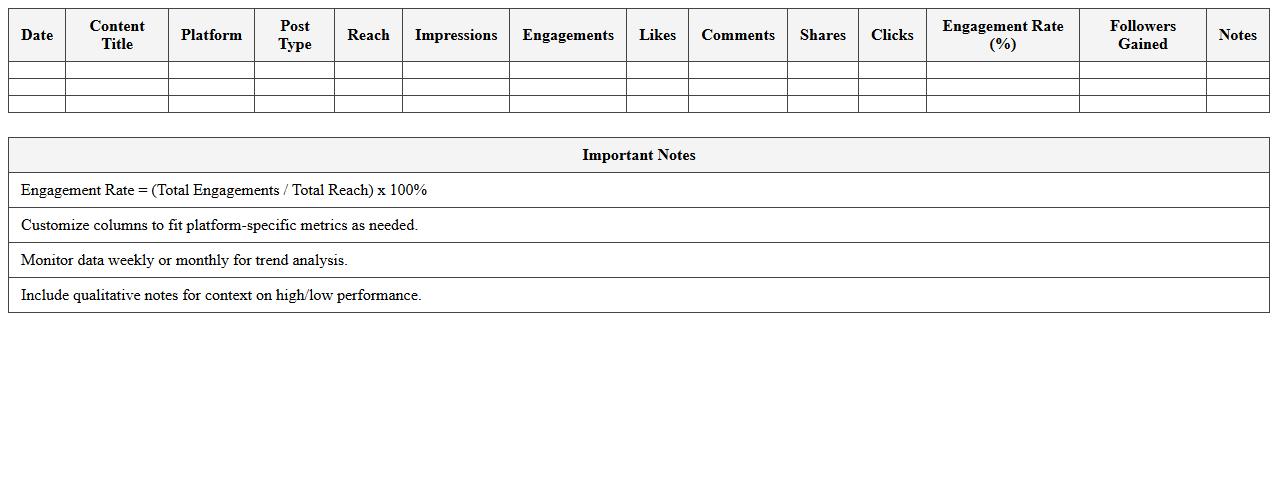
Social Media Content Performance Analytics Excel
The
Social Media Content Performance Analytics Excel document is a comprehensive tool designed to track, measure, and analyze the effectiveness of social media posts across various platforms. It compiles data such as engagement rates, reach, impressions, and follower growth to provide insightful metrics that help optimize content strategies. This document enables marketers and content creators to make data-driven decisions, improve audience targeting, and maximize the return on investment (ROI) from social media campaigns.
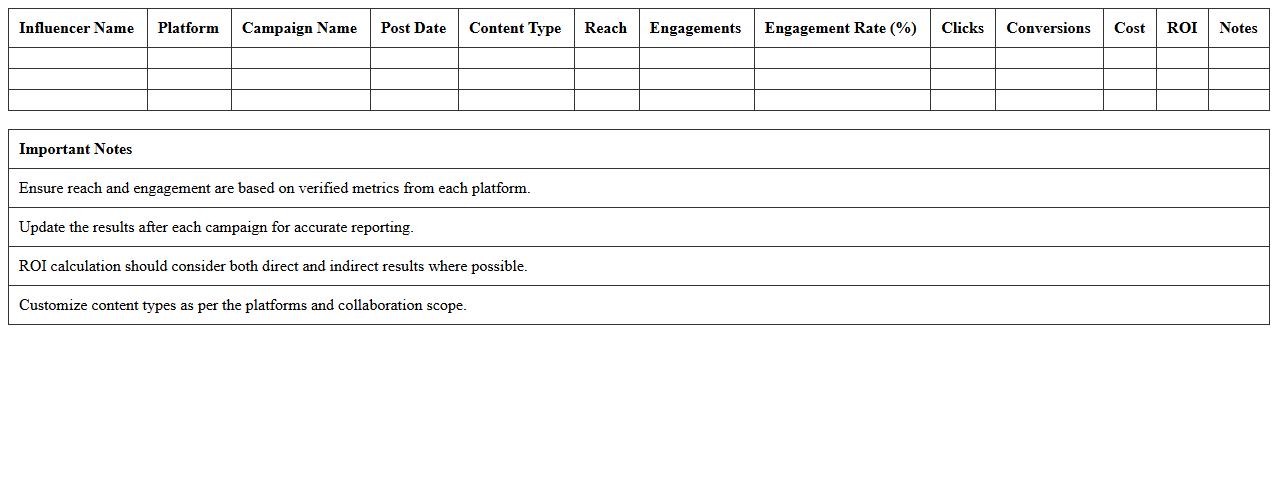
Influencer Collaboration Results Summary Excel Template
The
Influencer Collaboration Results Summary Excel Template is a comprehensive tool designed to track and analyze the performance metrics of influencer marketing campaigns. It consolidates data such as engagement rates, reach, conversions, and ROI, enabling marketers to evaluate partnership effectiveness and optimize future strategies. This template streamlines reporting processes, saving time while providing clear insights that support data-driven decision-making.
How can I automate Instagram engagement metrics tracking in my analytics report Excel sheet?
To automate Instagram engagement metrics tracking, use Excel's Power Query tool to import data directly from Instagram API or third-party connectors. Set up scheduled refreshes to keep your analytics updated without manual input. Additionally, incorporating formulas to calculate metrics like engagement rate can streamline your reporting process.
Which Excel formulas best calculate follower growth rates for influencer campaigns?
The ideal formula to calculate follower growth rate is ((New Followers - Old Followers) / Old Followers) * 100, which shows percentage increase. Use Excel's basic arithmetic operators along with cell referencing for dynamic updating. Complement this with conditional formatting to highlight significant growth changes visually.
What pivot table setup highlights top-performing content themes for influencers?
Create a pivot table with content themes as row labels and engagement metrics (likes, comments, shares) as values summarized by sum or average. Use filters to narrow down by campaign or date range for targeted insights. Sorting the pivot table by highest engagement reveals the most effective content themes quickly.
How do I visualize cross-platform reach and impressions in a single Excel dashboard?
Combine data from multiple platforms into one sheet and use Excel charts like stacked column charts or combo charts to display reach and impressions side-by-side. Incorporate slicers or timeline controls for interactive filtering by date or platform. This approach provides a clear, consolidated view of overall campaign performance.
What Excel template structure efficiently segments influencer data by sponsored vs. organic posts?
Design your Excel template with separate columns for post type labels such as "Sponsored" versus "Organic," linked to post engagement and date data. Use data validation dropdowns for consistent categorization and pivot tables to summarize performance per segment. This structure enables quick comparisons and detailed campaign analysis.