The Line Chart Excel Template for Financial Tracking provides a clear visual representation of financial data trends over time, making it easier to analyze income, expenses, and investments. This template offers customizable features to suit various financial tracking needs, enabling efficient monitoring of budget changes and financial goals. Its user-friendly interface enhances data interpretation and supports informed decision-making.
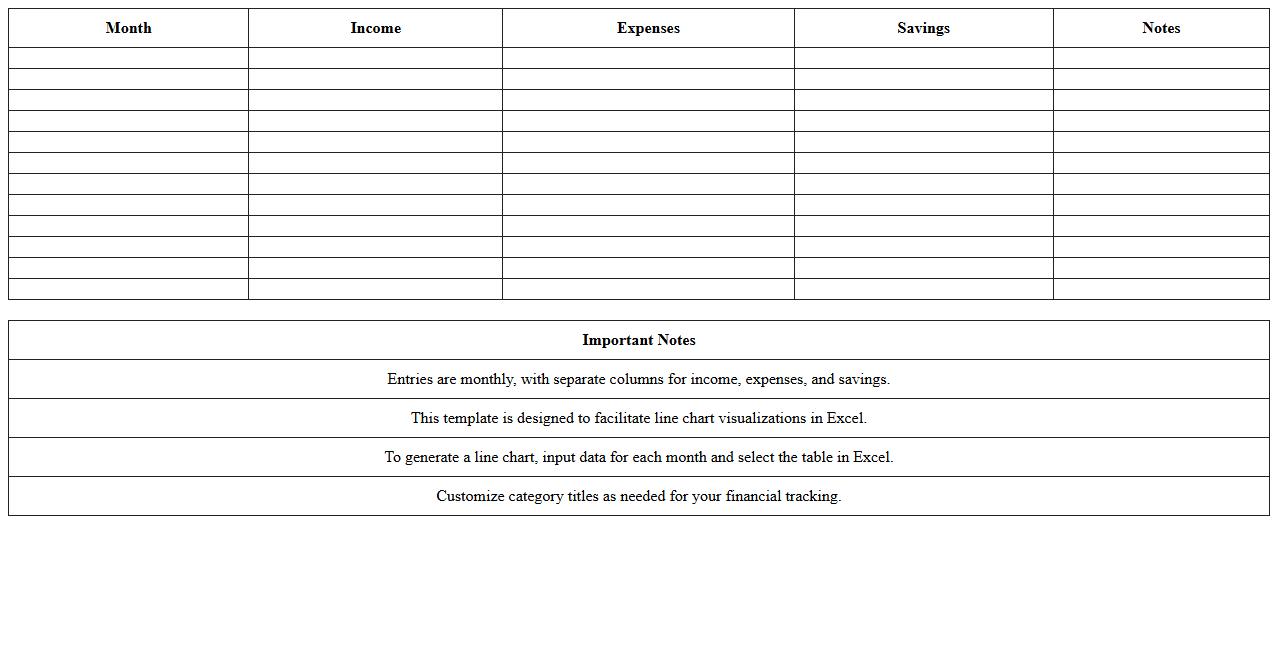
Monthly Financial Line Chart Excel Template
The
Monthly Financial Line Chart Excel Template is a pre-designed spreadsheet that visually tracks financial data trends over a month using line charts. It helps users easily monitor income, expenses, and cash flow fluctuations, enabling better budgeting and financial planning. This template simplifies complex data analysis by providing clear, visual insights for improved decision-making in personal or business finances.
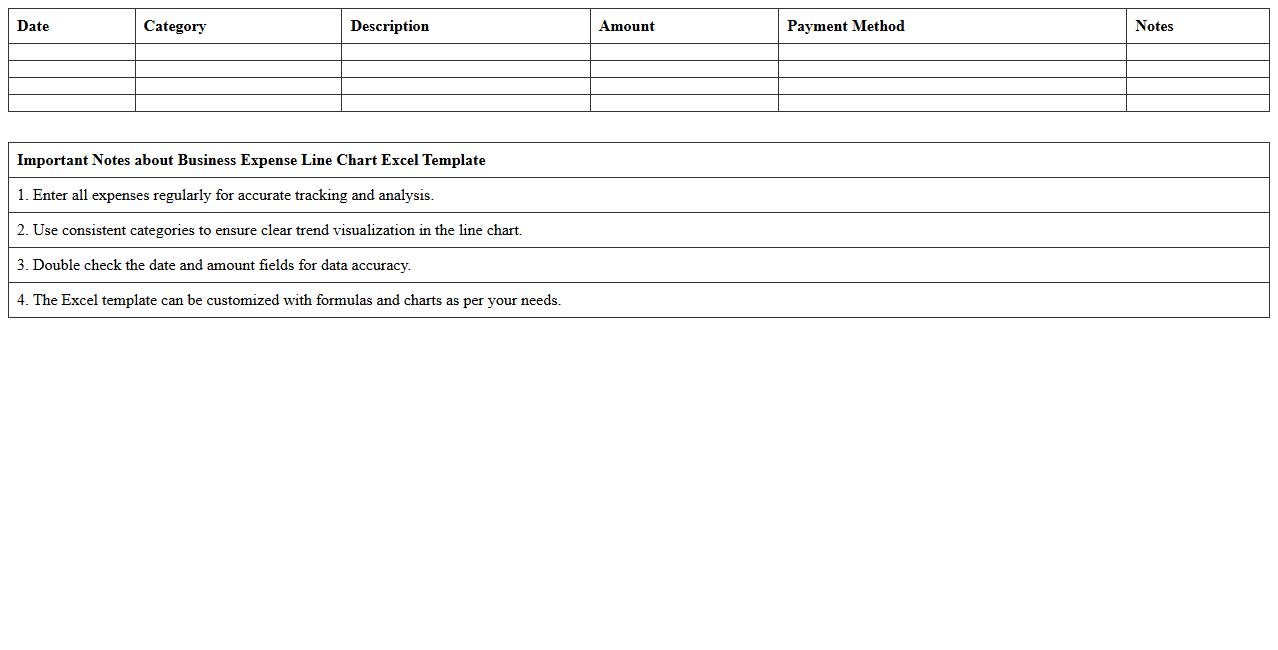
Business Expense Line Chart Excel Template
The
Business Expense Line Chart Excel Template is a pre-designed spreadsheet that visually tracks and analyzes company expenses over time, enabling easy identification of spending trends. It helps businesses monitor budget adherence, forecast future costs, and make informed financial decisions through clear, customizable line charts. This tool optimizes expense management efficiency by providing actionable insights into cash flow and cost control.
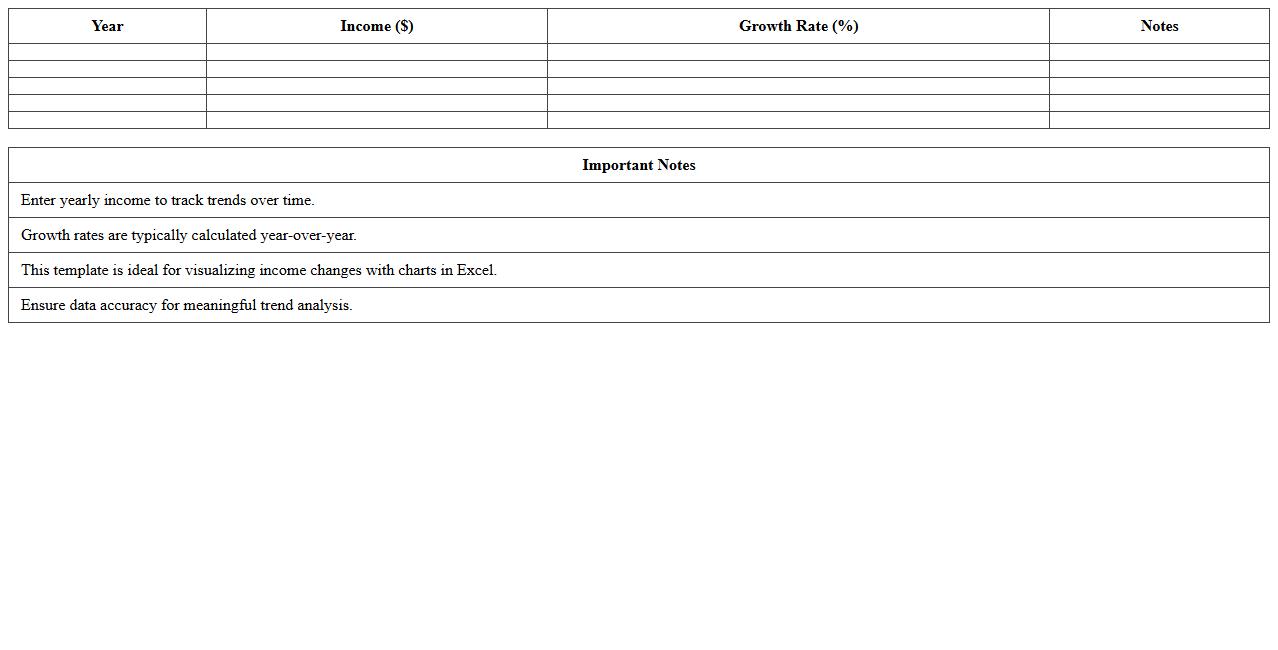
Income Trends Line Chart Excel Template
The
Income Trends Line Chart Excel Template document visually represents income data over time, allowing users to identify patterns, fluctuations, and growth trajectories efficiently. It is useful for tracking financial performance, budgeting, forecasting, and making informed decisions based on historical income trends. This template simplifies complex data into an easy-to-understand format, enhancing analysis accuracy and time management.
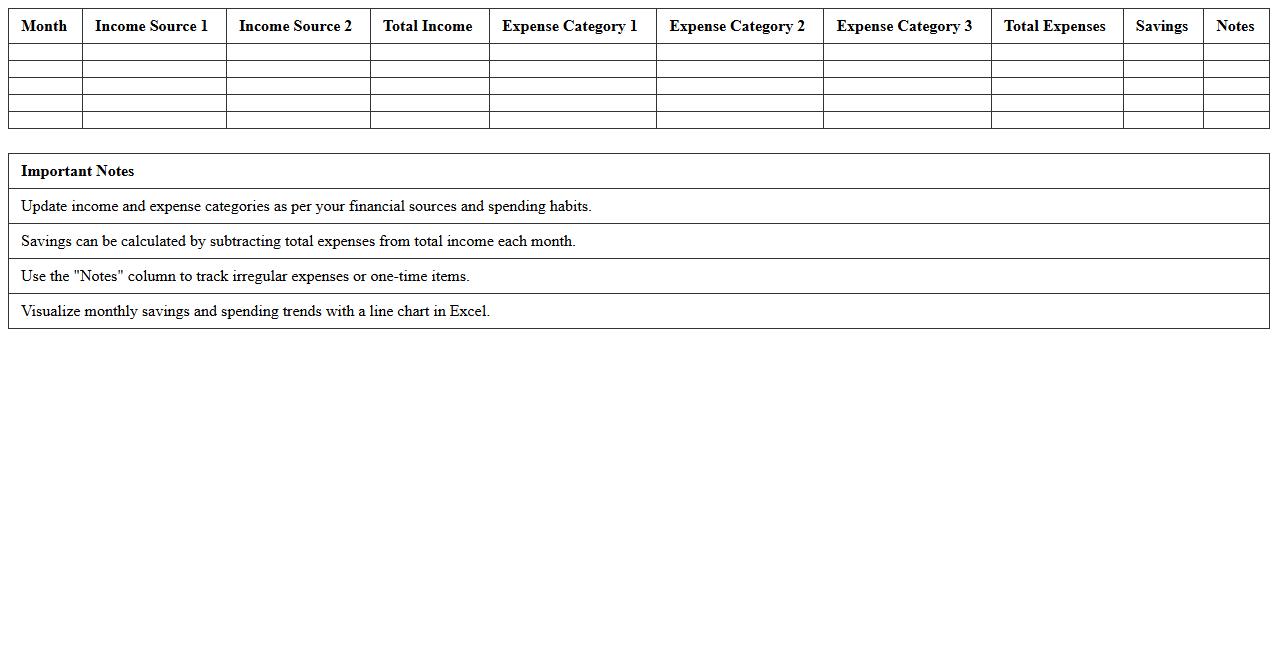
Personal Budget Line Chart Excel Template
The
Personal Budget Line Chart Excel Template is a customizable financial planning tool designed to track and visualize income, expenses, and savings over time. It helps users identify spending patterns, set realistic budget goals, and make informed decisions to improve financial stability. By providing clear graphical representations, this template enhances budget management efficiency and promotes better money control.
Cash Flow Tracking Line Chart Excel Template
The
Cash Flow Tracking Line Chart Excel Template is a powerful financial tool designed to visually represent inflows and outflows over time, enabling efficient monitoring of cash movement. It helps businesses and individuals identify trends, forecast future cash positions, and make informed decisions to maintain liquidity. By providing an intuitive graphical overview, it simplifies complex financial data into actionable insights, improving cash management and financial planning.
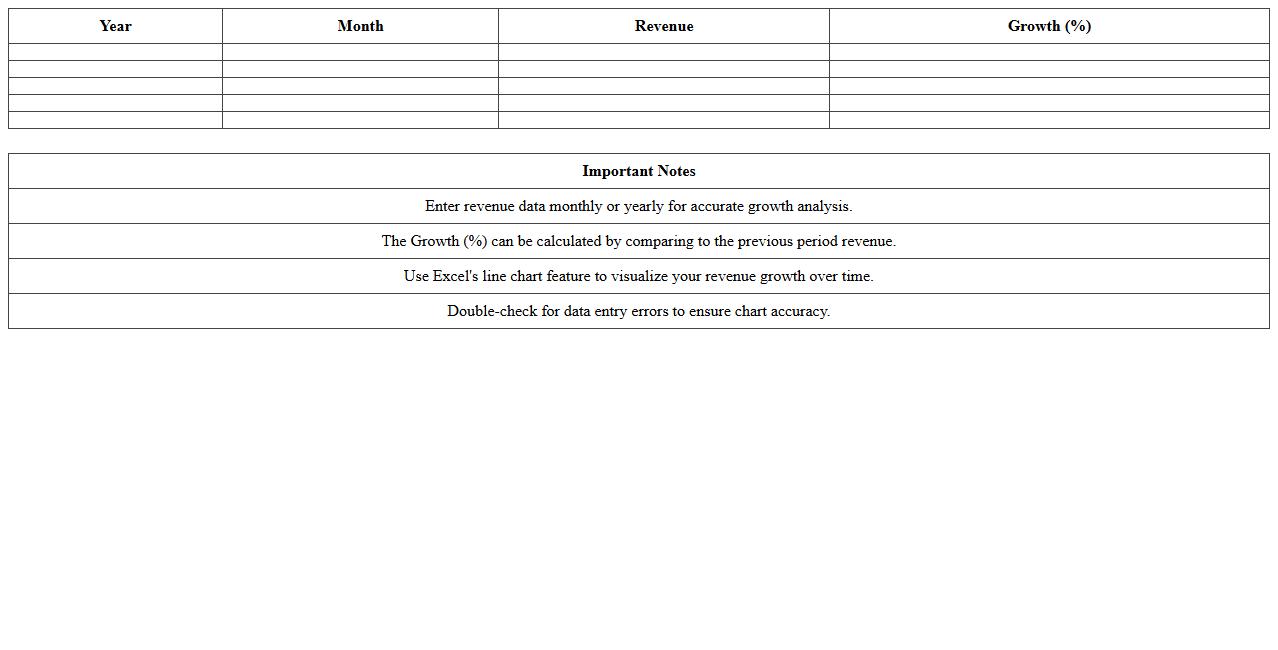
Revenue Growth Line Chart Excel Template
The
Revenue Growth Line Chart Excel Template document is a pre-designed spreadsheet that visually represents a company's revenue trends over specific time periods using line charts. This template helps users easily track and analyze financial performance, identify growth patterns, and make data-driven decisions for future business strategies. It is especially useful for financial analysts, business owners, and managers to communicate revenue progress clearly and efficiently.
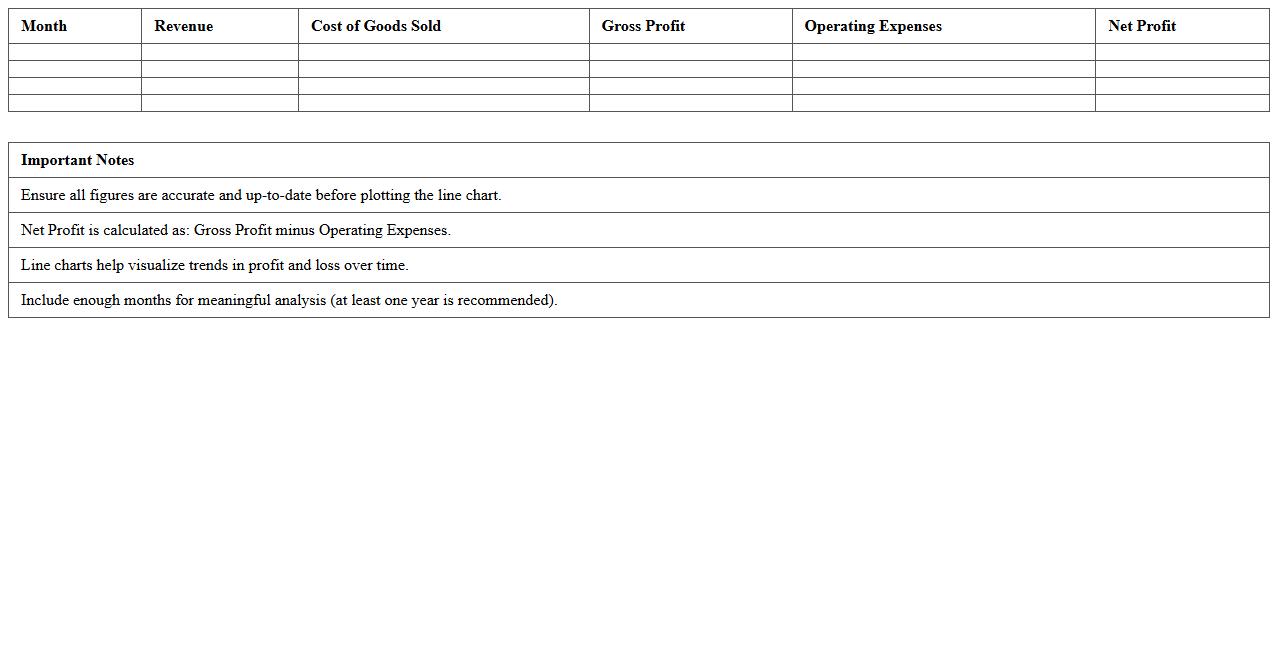
Profit and Loss Line Chart Excel Template
The
Profit and Loss Line Chart Excel Template document visually represents financial performance over time by plotting revenue, expenses, and net profit trends. This tool enables users to quickly identify patterns, track business growth, and make informed budgetary decisions. Utilizing this template improves accuracy in financial analysis and enhances strategic planning efficiency.
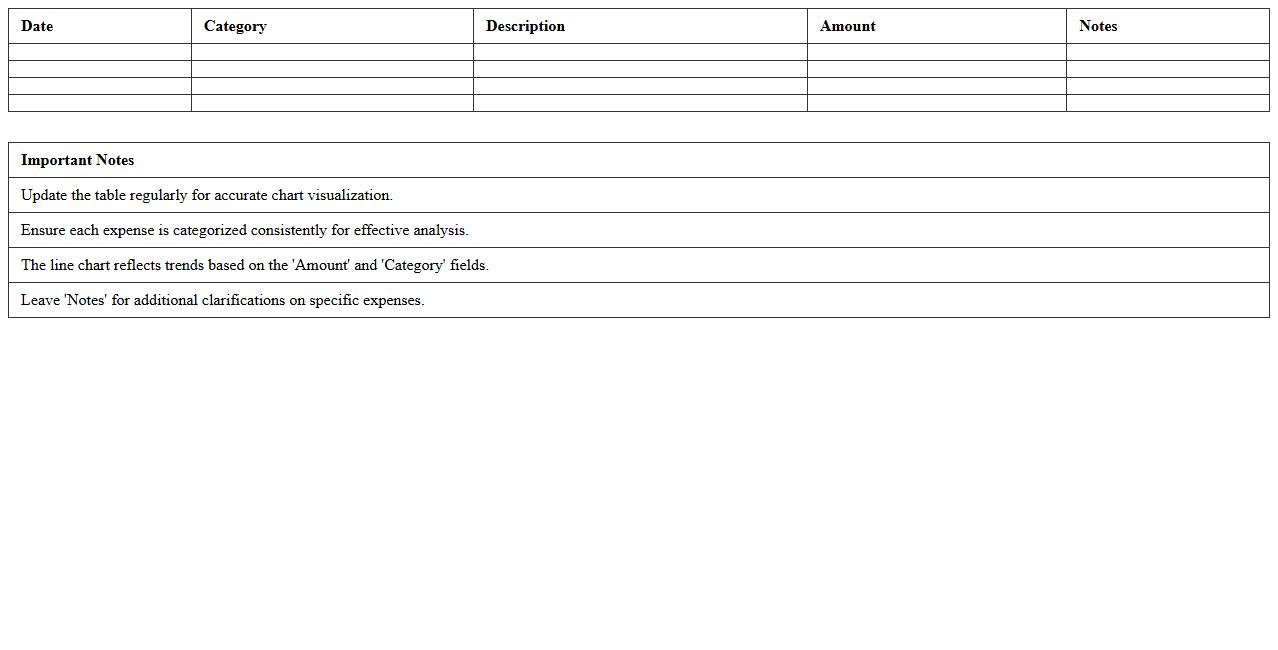
Expense Category Line Chart Excel Template
The
Expense Category Line Chart Excel Template is a pre-designed spreadsheet that allows users to track and visualize expenses across different categories over time. This tool simplifies financial analysis by providing clear insights into spending patterns, enabling better budget management and financial planning. Businesses and individuals benefit from its intuitive design, which enhances decision-making through organized data representation and trend identification.
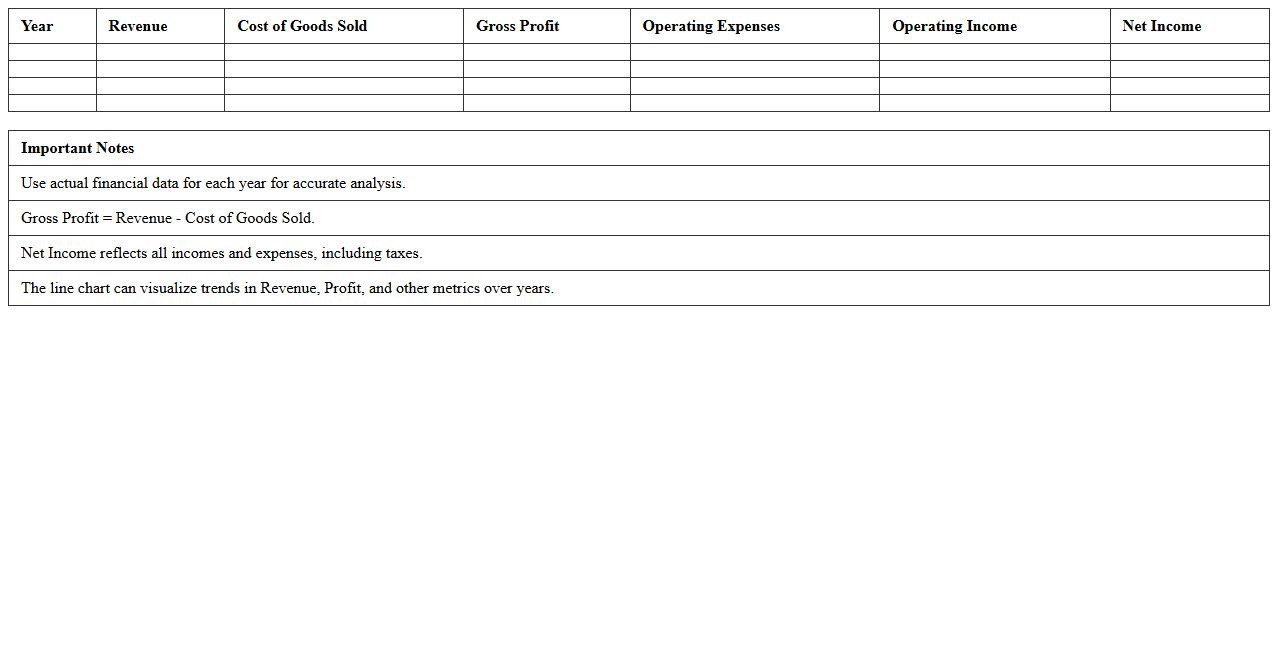
Yearly Financial Line Chart Excel Template
A
Yearly Financial Line Chart Excel Template document visually represents financial data trends over a year, allowing users to track income, expenses, and profit fluctuations efficiently. It helps businesses and individuals quickly identify patterns, make informed budgeting decisions, and forecast future financial performance. This template streamlines data analysis by providing a clear, customizable graphical overview of financial metrics throughout the year.
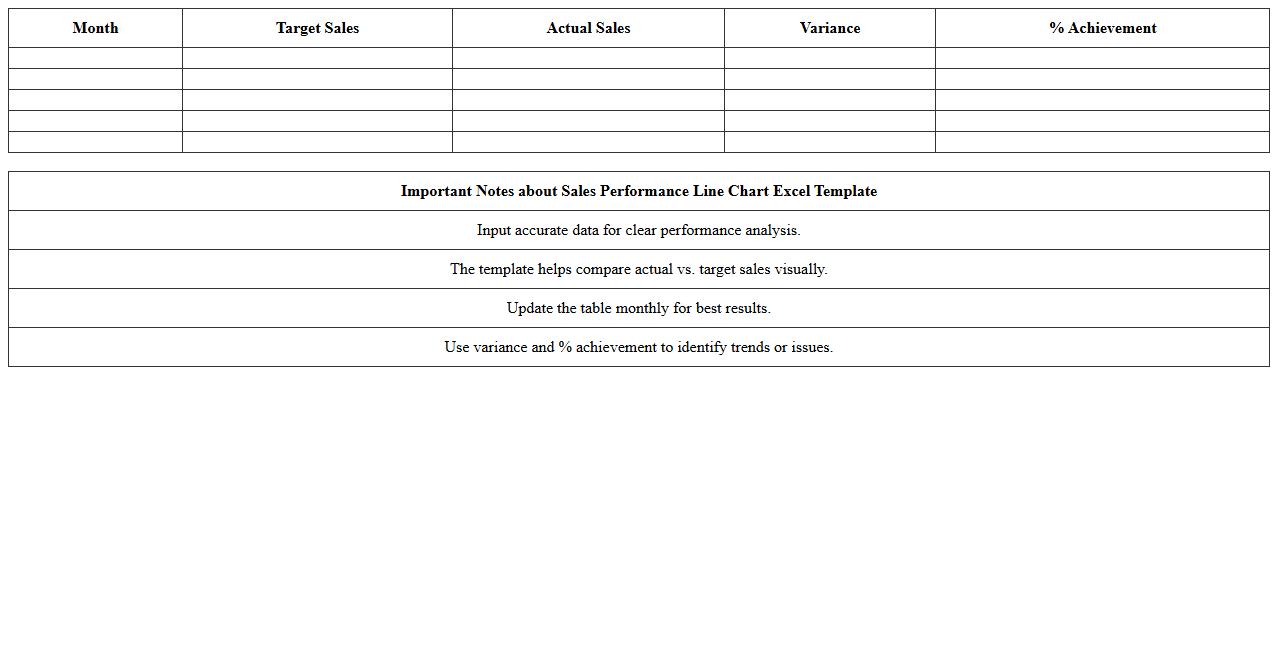
Sales Performance Line Chart Excel Template
The
Sales Performance Line Chart Excel Template document visually tracks and analyzes sales trends over time, enabling businesses to identify patterns and measure growth effectively. It simplifies complex data into clear, customizable line charts that highlight key metrics such as monthly revenue, sales targets, and product performance. This tool supports informed decision-making by providing actionable insights that enhance sales strategy and forecasting accuracy.
How can I automate monthly balance updates in a line chart for financial tracking in Excel?
Automate monthly balance updates by using dynamic named ranges that adjust as new data is added. Linking the line chart to these ranges ensures it automatically reflects the latest figures. Additionally, incorporating Excel's Table feature helps maintain data organization and seamless chart updates.
What are effective methods to visualize expense trends using multi-series line charts in Excel?
To visualize expense trends, use multi-series line charts that display different categories over time for easy comparison. Applying distinct colors and markers for each series enhances chart readability. Incorporating trendlines or smoothing options further highlights overall spending patterns effectively.
How do I link dynamic financial data from multiple sheets to a single line chart in Excel?
Link dynamic financial data by using consolidated references across multiple sheets, converging them into a summary sheet. Create dynamic ranges with functions like INDIRECT or OFFSET to pull updated data into the chart dataset. This approach keeps the line chart synchronized with all source sheets automatically.
Which Excel formulas best support cumulative cash flow tracking in a line chart?
Use the SUM function for running totals combined with absolute referencing to calculate cumulative cash flow accurately. The SUMIFS formula can also filter values dynamically for date ranges or categories. Displaying these results in a line chart visualizes the growing cumulative balance over time clearly.
How can I highlight budget threshold breaches on a financial line chart in Excel?
Highlight budget breaches by adding conditional formatting rules or separate series that flag values exceeding set thresholds. Employ different line styles or colors to differentiate areas where spending surpasses the budget. Enhancing the chart with data labels or markers further emphasizes critical threshold violations.
More Chart Excel Templates