The Financial Risk Assessment Excel Template for Investment Portfolios offers a powerful tool to analyze and manage potential risks in diverse investment holdings. It enables users to input portfolio data, calculate risk metrics, and visualize exposure through dynamic charts. This template supports informed decision-making by highlighting volatility, value at risk, and diversification effects efficiently.
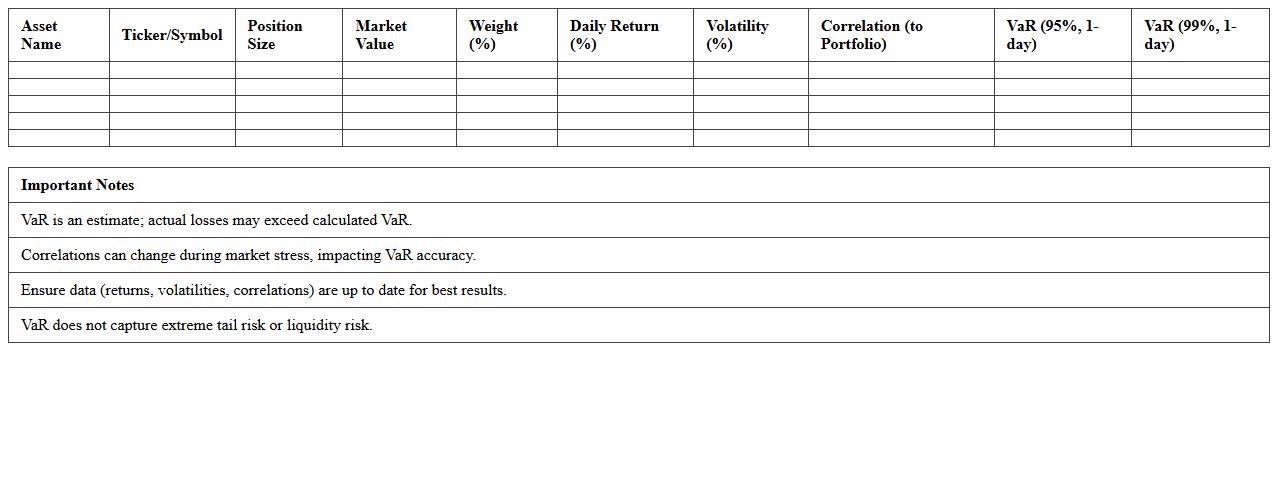
Portfolio Value-at-Risk (VaR) Assessment Excel Template
The
Portfolio Value-at-Risk (VaR) Assessment Excel Template is a powerful tool designed to quantify the potential loss in value of an investment portfolio over a specified time frame and confidence level. It leverages historical data, volatility measures, and correlations between assets to estimate the maximum expected loss, enabling investors to manage risk exposure effectively. By providing clear, data-driven insights, this template supports informed decision-making, enhances portfolio risk management, and helps in meeting regulatory compliance requirements.
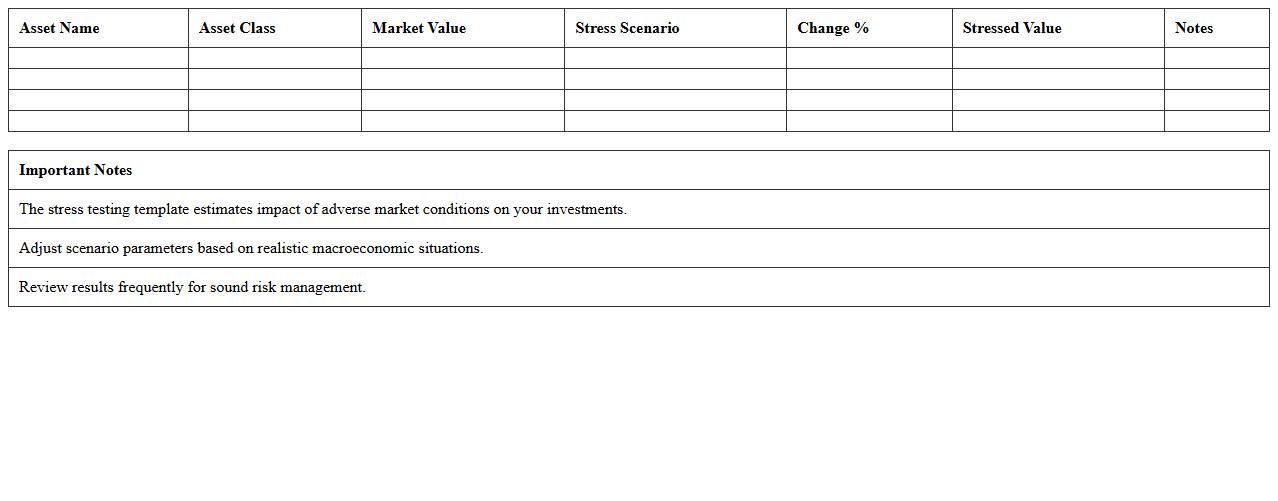
Investment Portfolio Stress Testing Excel Spreadsheet
An
Investment Portfolio Stress Testing Excel Spreadsheet is a financial tool designed to simulate various market scenarios and assess the resilience of an investment portfolio under adverse conditions. By inputting asset allocations and market variables, investors can identify potential vulnerabilities and quantify risks associated with economic downturns, interest rate fluctuations, or geopolitical events. This spreadsheet enhances decision-making by providing actionable insights to optimize portfolio diversification and safeguard against significant losses.
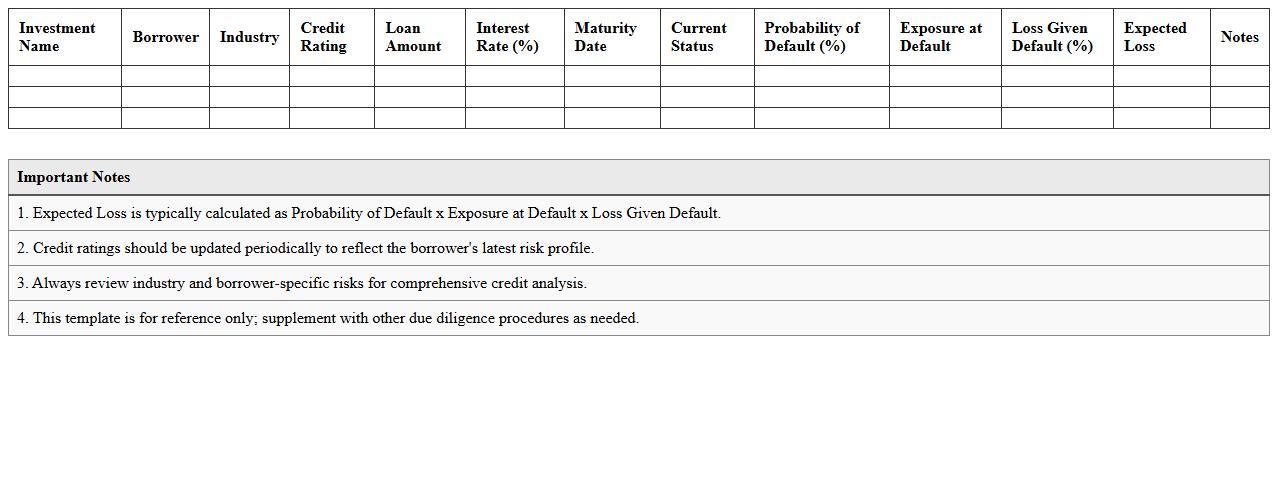
Credit Risk Analysis Excel Template for Investments
The
Credit Risk Analysis Excel Template for investments is a structured financial tool designed to evaluate the creditworthiness of borrowers by analyzing their payment history, debt levels, and overall financial health. This template facilitates informed decision-making by providing detailed risk assessment metrics and customizable data fields, enabling investors to identify potential default risks efficiently. It streamlines the investment evaluation process, helping to minimize financial losses and optimize portfolio performance through accurate credit risk insights.
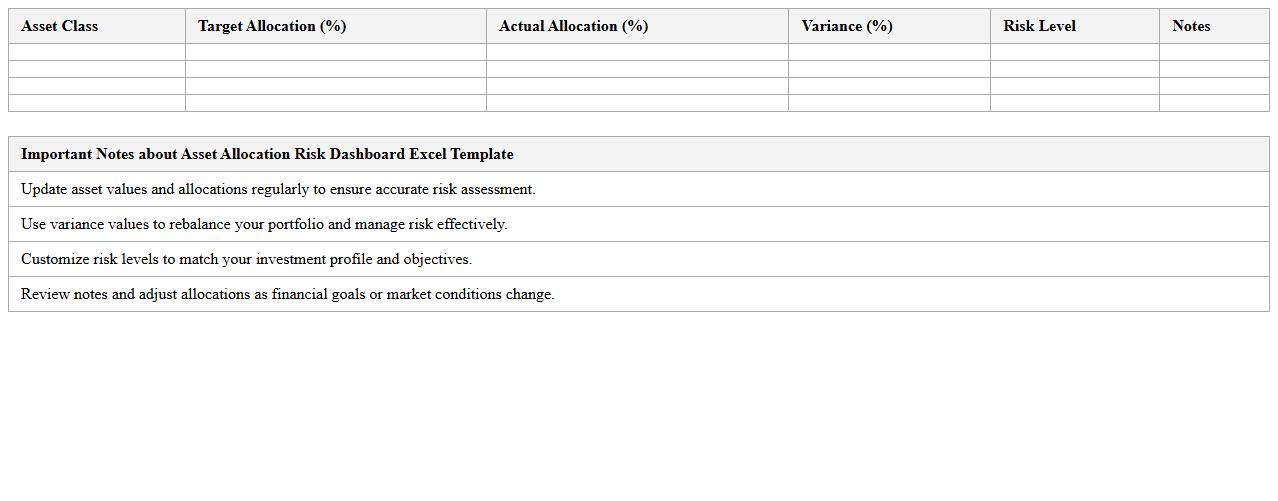
Asset Allocation Risk Dashboard Excel Template
The
Asset Allocation Risk Dashboard Excel Template is a dynamic tool designed to visually represent the distribution and risk profile of investment portfolios. It provides investors and financial analysts with clear insights into asset class exposures, enabling effective monitoring and balancing of investment risk. By using this template, users can make informed decisions to optimize portfolio performance while maintaining risk within desired thresholds.
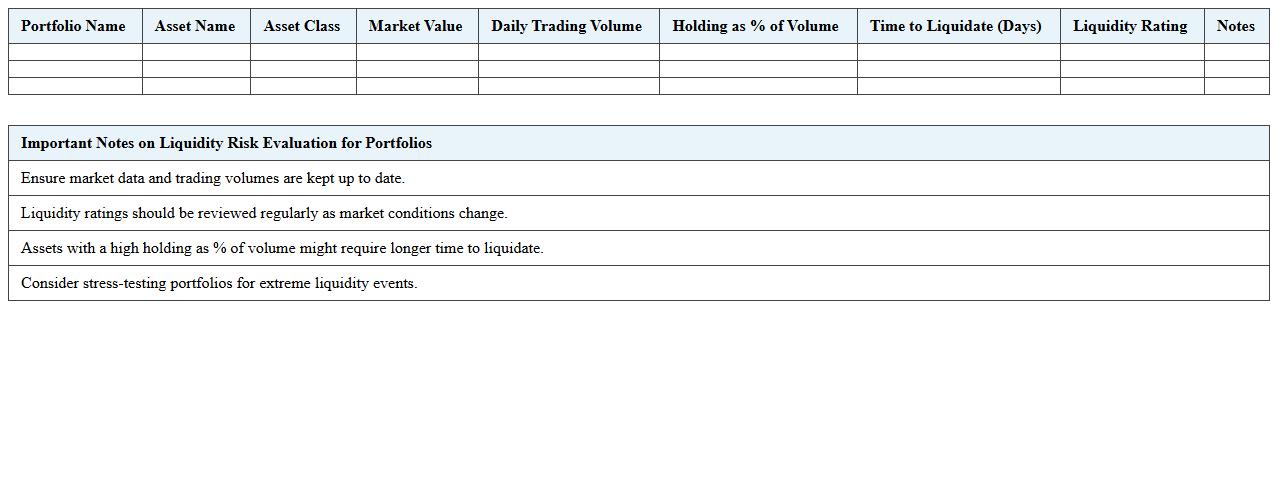
Liquidity Risk Evaluation Excel Sheet for Portfolios
The
Liquidity Risk Evaluation Excel Sheet for Portfolios is a specialized tool designed to assess the liquidity risk associated with various investment portfolios by analyzing cash flow timelines, market depth, and asset convertibility. It helps investors and risk managers identify potential liquidity shortfalls and estimate the ease with which assets can be sold without significant price impact. Using this sheet improves decision-making around portfolio adjustments, ensuring better risk mitigation and enhanced portfolio resilience in fluctuating market conditions.
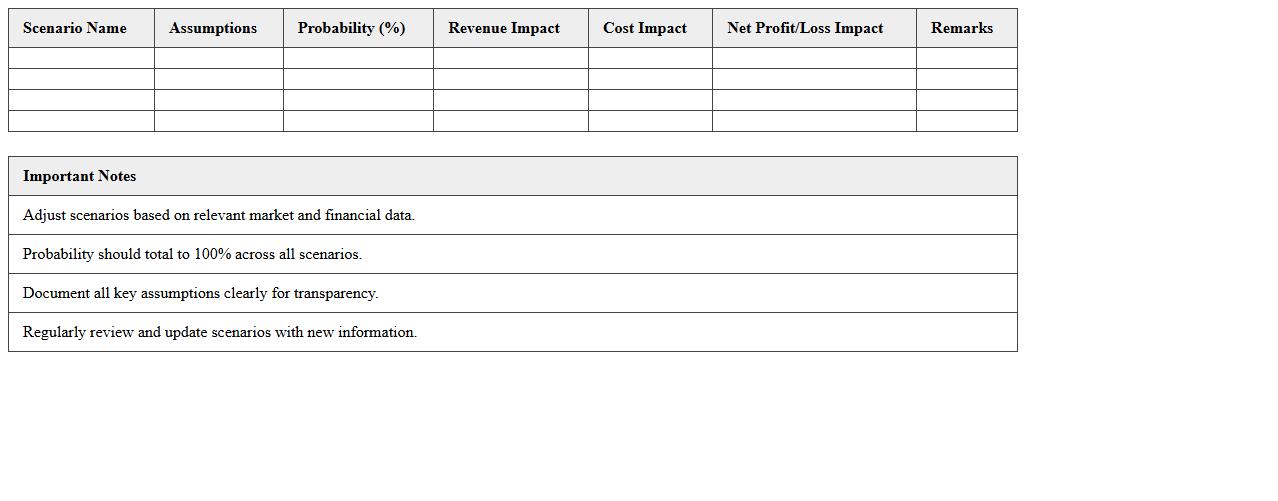
Scenario Analysis Excel Template for Financial Risks
Scenario Analysis Excel Template for Financial Risks is a powerful tool designed to evaluate potential financial outcomes under various hypothetical situations. It enables businesses to identify risks, quantify their impacts, and develop strategic responses by modeling different economic conditions, market changes, and operational variables. Using this
scenario analysis template helps organizations enhance decision-making, improve risk management, and prepare for uncertainties with data-driven insights.
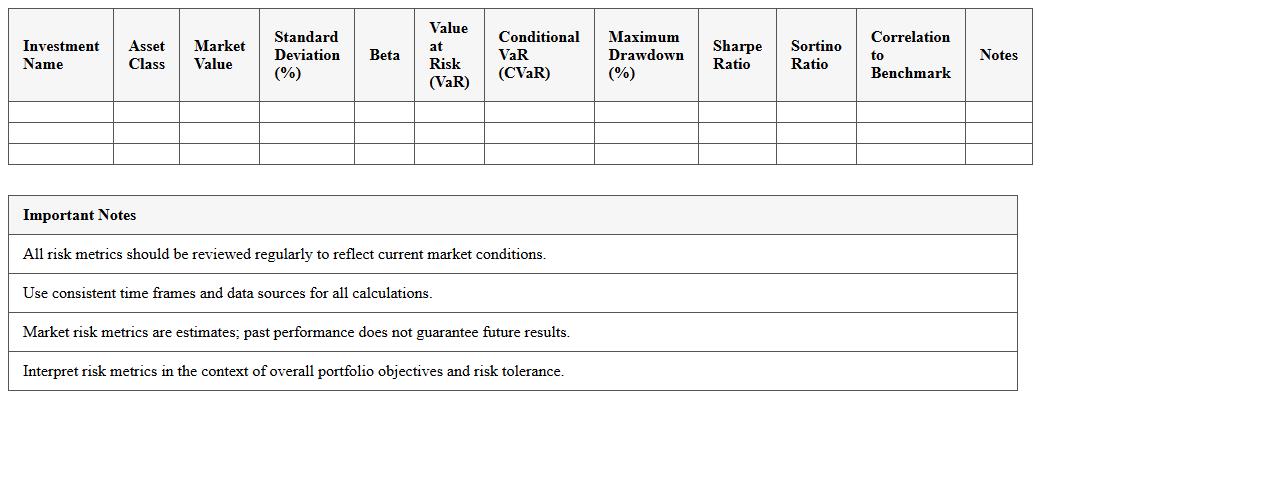
Market Risk Metrics Excel Template for Investments
The
Market Risk Metrics Excel Template for investments is a comprehensive tool designed to quantify and analyze potential risks in financial portfolios. It enables users to calculate key risk indicators such as Value at Risk (VaR), volatility, and beta, helping investors anticipate potential losses under various market conditions. By systematically organizing risk data, this template supports informed decision-making and enhances portfolio risk management strategies.
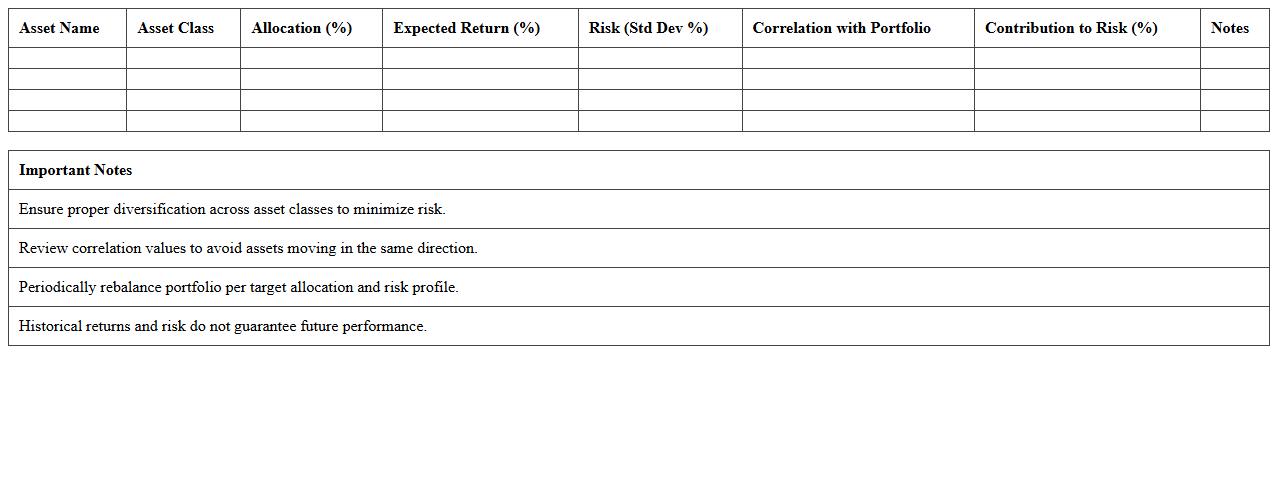
Portfolio Diversification Risk Analysis Excel Sheet
The
Portfolio Diversification Risk Analysis Excel Sheet is a powerful financial tool designed to evaluate and manage investment risks by analyzing asset allocation and correlation among portfolio holdings. It helps investors identify potential vulnerabilities and optimize diversification to minimize risk exposure while maximizing returns. Using this document enables more informed decision-making, improving overall portfolio performance and stability.
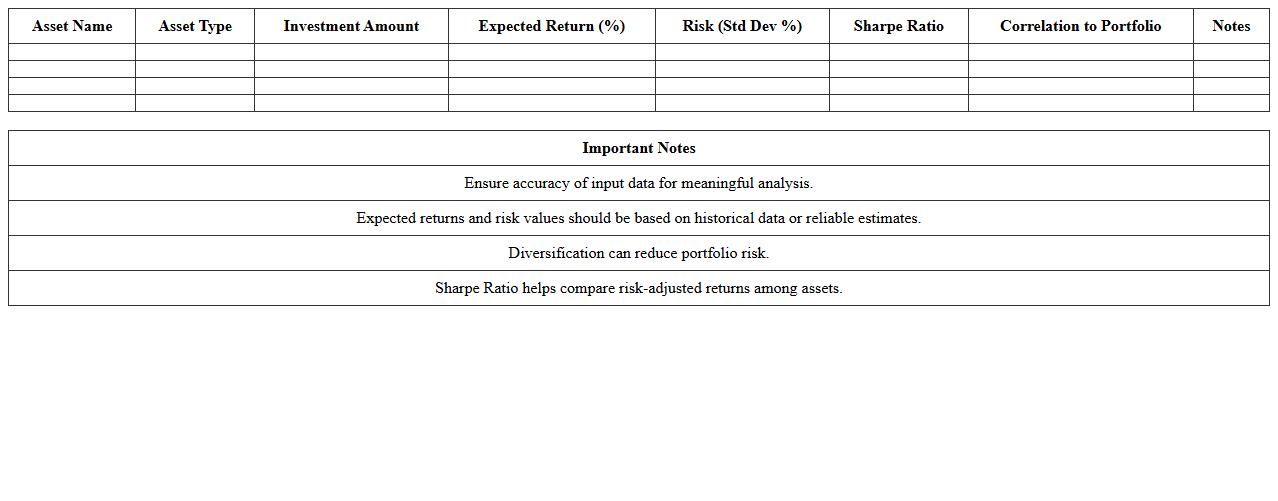
Risk-Return Profile Excel Template for Investment Portfolios
The
Risk-Return Profile Excel Template for Investment Portfolios is a tool designed to analyze and visualize the balance between potential risks and expected returns of various investments. It helps investors evaluate portfolio performance by calculating key metrics such as volatility, Sharpe ratio, and expected returns, enabling data-driven decisions. Utilizing this template enhances portfolio optimization and risk management, making it easier to align investments with individual financial goals.
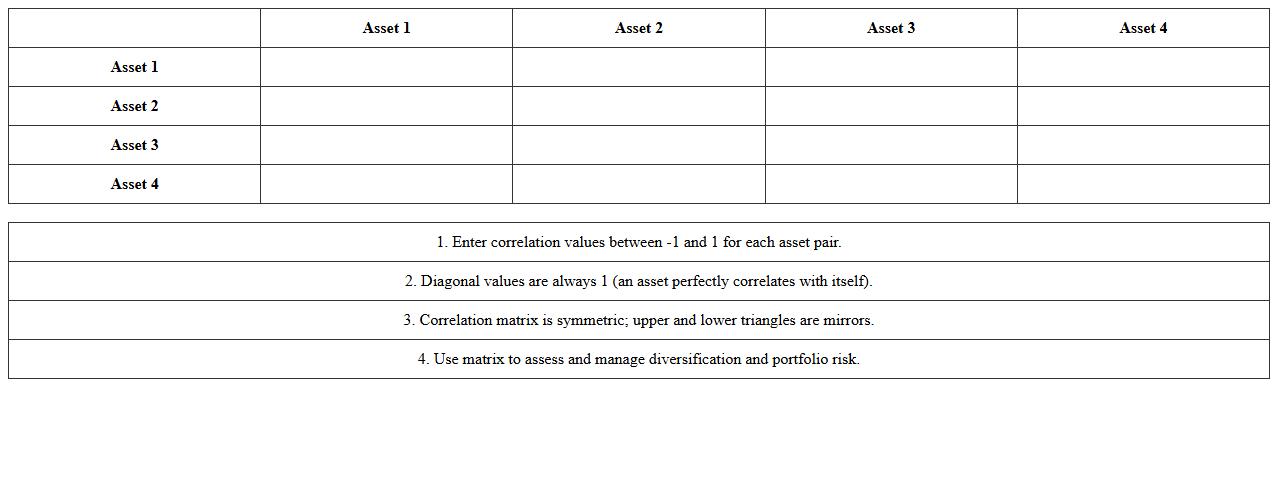
Correlation Matrix Excel Template for Portfolio Risk
A
Correlation Matrix Excel Template for Portfolio Risk is a tool designed to quantify and visualize the relationships between different asset returns within an investment portfolio. By calculating the correlation coefficients, it helps investors understand how asset prices move relative to each other, enabling more informed diversification strategies. This template facilitates risk assessment and optimization by identifying exposures and potential concentrations, ultimately aiding in the construction of a balanced and resilient portfolio.
How can automated macros in Excel streamline stress-testing scenarios for portfolio risk documents?
Automated macros in Excel can significantly speed up the process of running multiple stress-testing scenarios by executing repetitive tasks without manual intervention. They enable the systematic application of different market conditions and assumptions across the portfolio risk model efficiently. This automation enhances accuracy and consistency in stress-testing, reducing the risk of human error in portfolio risk documents.
What formulas best calculate conditional Value at Risk (CVaR) for diversified assets?
The CVaR calculation for diversified assets commonly uses formulas involving expected tail loss over a specified confidence level, often integrating Excel functions like SUMPRODUCT and IF. Advanced methods incorporate asset weights with loss distributions to compute the Conditional Value at Risk accurately. Utilizing matrix operations and conditional statements in Excel formulas optimizes the precision of CVaR for diversified portfolios.
In what ways can linked Excel sheets enhance real-time data validation for financial risk letters?
Linked Excel sheets allow for the automatic synchronization of data inputs and outputs across multiple workbooks, ensuring the latest figures are always available during the preparation of financial risk letters. This setup enables instant data validation by cross-referencing changes and enforcing consistency rules dynamically. Ultimately, it reduces manual reconciliation efforts and supports more reliable, up-to-date financial reviews and risk assessments.
Which Excel add-ins effectively visualize correlation matrices for risk assessment documentation?
Excel add-ins like XLSTAT, Analyse-it, and the built-in Power Map offer advanced capabilities to visualize correlation matrices through heat maps, scatter plots, and interactive charts. These tools help risk analysts interpret complex inter-asset relationships intuitively within risk assessment documentation. Such visualizations support enhanced decision-making by clearly highlighting significant correlations that affect portfolio risk.
How do dynamic dashboards in Excel improve reporting accuracy in investment portfolio letters?
Dynamic dashboards in Excel consolidate key risk metrics and portfolio performance indicators into interactive, real-time displays. They allow users to filter, drill down, and update data instantly, reducing reporting delays and manual errors in investment portfolio letters. This functionality ensures that stakeholders receive accurate, transparent information for better investment decision-making and risk communication.
More Assessment Excel Templates