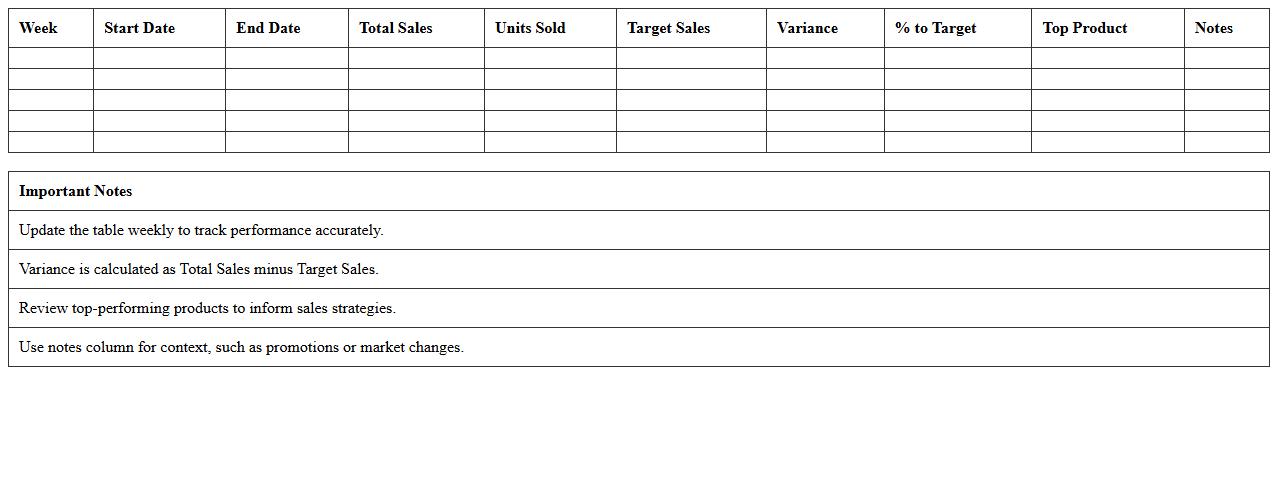
Weekly Sales Performance Analysis Excel Template
The
Weekly Sales Performance Analysis Excel Template is a comprehensive tool designed to track and evaluate sales data on a weekly basis, enabling businesses to monitor key metrics such as revenue, units sold, and sales growth. It simplifies the process of identifying trends, spotting underperforming products, and measuring team effectiveness through visual dashboards and automated calculations. This template enhances decision-making by providing clear insights into sales performance, helping organizations optimize strategies and improve overall profitability.
Retail Store Weekly Revenue Tracking Template
The
Retail Store Weekly Revenue Tracking Template is a structured document designed to monitor and analyze weekly sales performance metrics for retail businesses. It helps store managers and financial analysts identify trends, forecast sales, and make data-driven decisions to optimize inventory and staffing. By providing a clear overview of weekly revenue, this template enhances financial accuracy and supports strategic planning efforts.
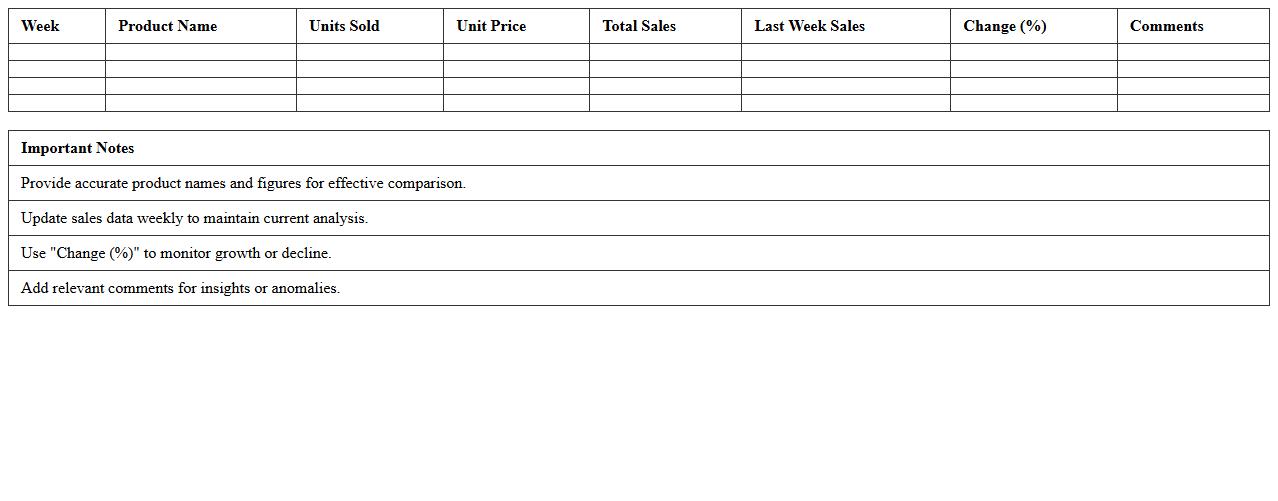
Weekly Product Sales Comparison Excel Sheet
A
Weekly Product Sales Comparison Excel Sheet is a structured document designed to track and compare sales figures of different products on a weekly basis. It helps businesses identify trends, measure performance against targets, and make data-driven decisions to optimize inventory and marketing strategies. By consolidating sales data in a clear, visual format, it enhances efficiency in monitoring sales growth and detecting underperforming products promptly.
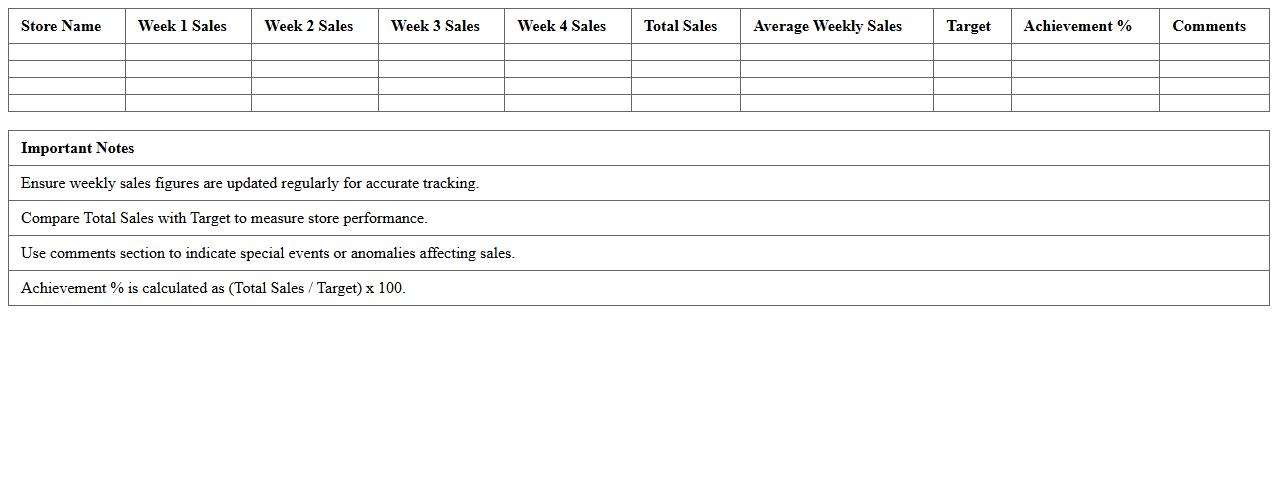
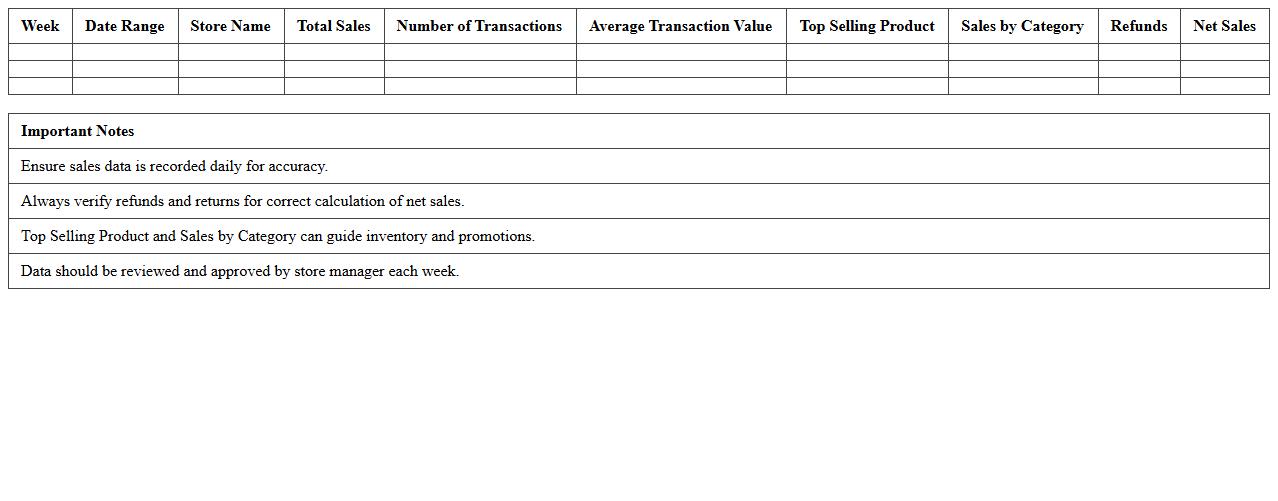
Store-wise Weekly Sales Dashboard Template
The
Store-wise Weekly Sales Dashboard Template document provides a comprehensive view of sales performance across multiple store locations on a weekly basis, enabling businesses to track revenue trends, identify top-performing stores, and pinpoint areas needing improvement. This template organizes key metrics such as total sales, average transaction value, and units sold, facilitating data-driven decision-making and efficient resource allocation. By visualizing sales data in a clear, comparative format, it helps managers optimize inventory, enhance marketing strategies, and ultimately boost overall profitability.
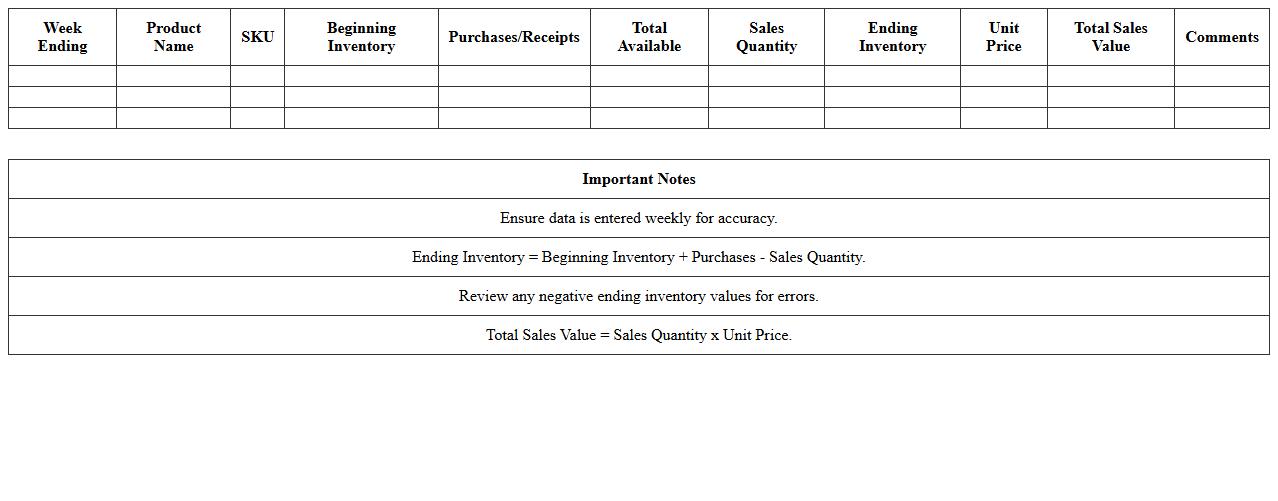
Weekly Sales & Inventory Report Excel Template
The
Weekly Sales & Inventory Report Excel Template is a structured document designed to track product sales and inventory levels on a weekly basis, enabling businesses to monitor performance and stock status efficiently. It helps identify trends, manage reorder points, and reduce stockouts or overstock situations by providing clear, organized data summaries. Utilizing this template improves decision-making, streamlines inventory management, and enhances overall operational efficiency.
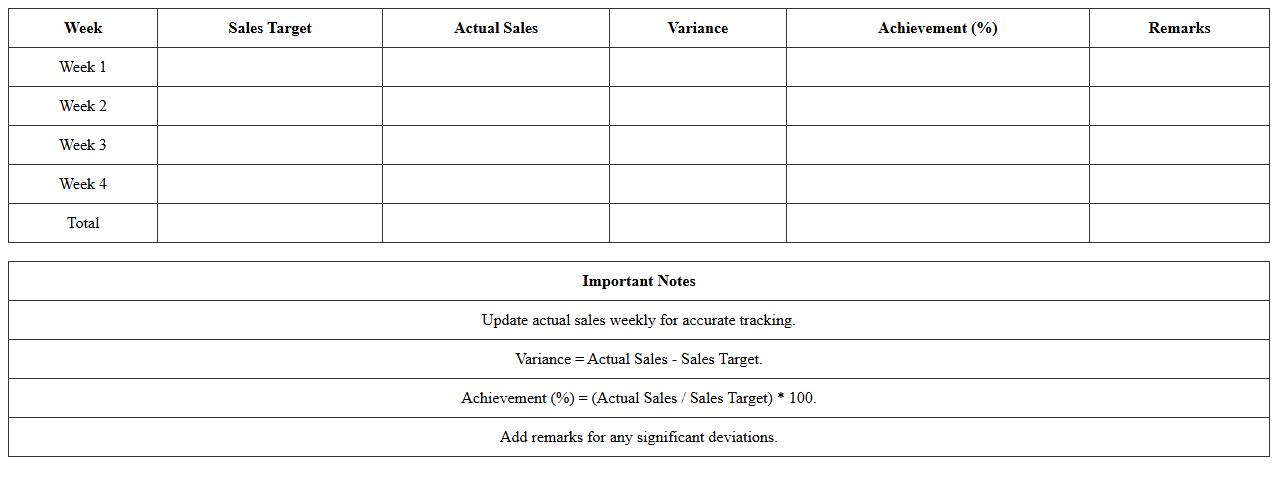
Weekly Sales Target vs Achievement Excel Sheet
The
Weekly Sales Target vs Achievement Excel Sheet document tracks planned sales goals against actual sales accomplished each week, allowing businesses to monitor performance and identify trends. This tool helps sales teams stay accountable, allocate resources effectively, and make data-driven decisions to boost revenue. Analyzing the variance between targets and achievements highlights areas for improvement and supports strategic planning.
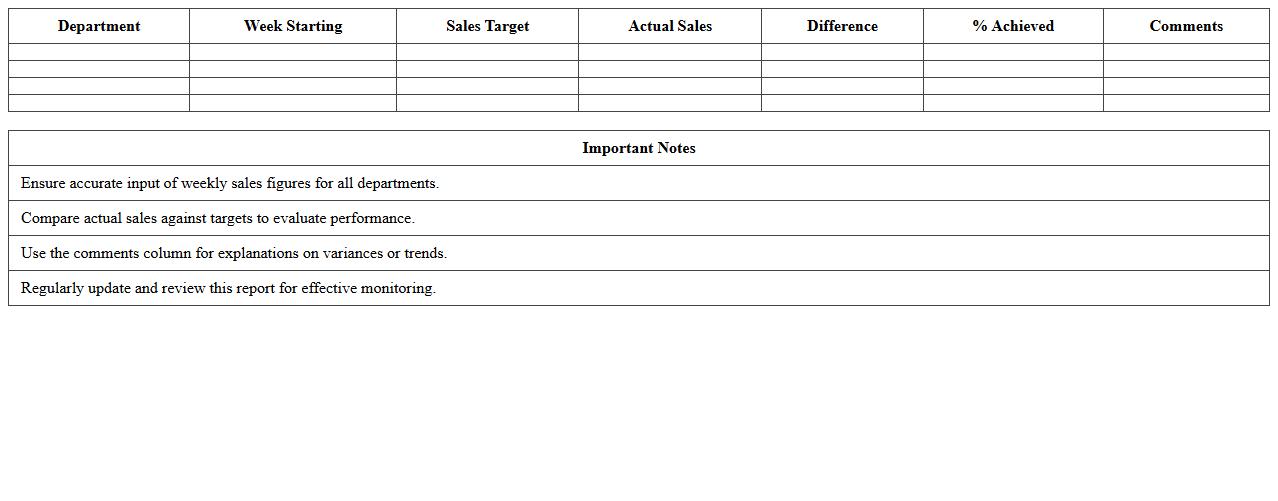
Weekly Departmental Sales Report Template
The
Weekly Departmental Sales Report Template is a structured document designed to track and summarize the sales performance of various departments within an organization on a weekly basis. It enables managers to monitor key sales metrics, identify trends, and make data-driven decisions to improve overall revenue. By providing consistent and clear insights, this template helps streamline communication and optimize sales strategies across departments.
Retail Store Weekly Sales Breakdown Excel
The
Retail Store Weekly Sales Breakdown Excel document provides detailed insights into sales performance by categorizing revenue data on a weekly basis for each retail location. This analysis helps businesses identify sales trends, monitor product performance, and optimize inventory management effectively. Retail managers leverage these breakdowns to make data-driven decisions that enhance profitability and customer satisfaction.
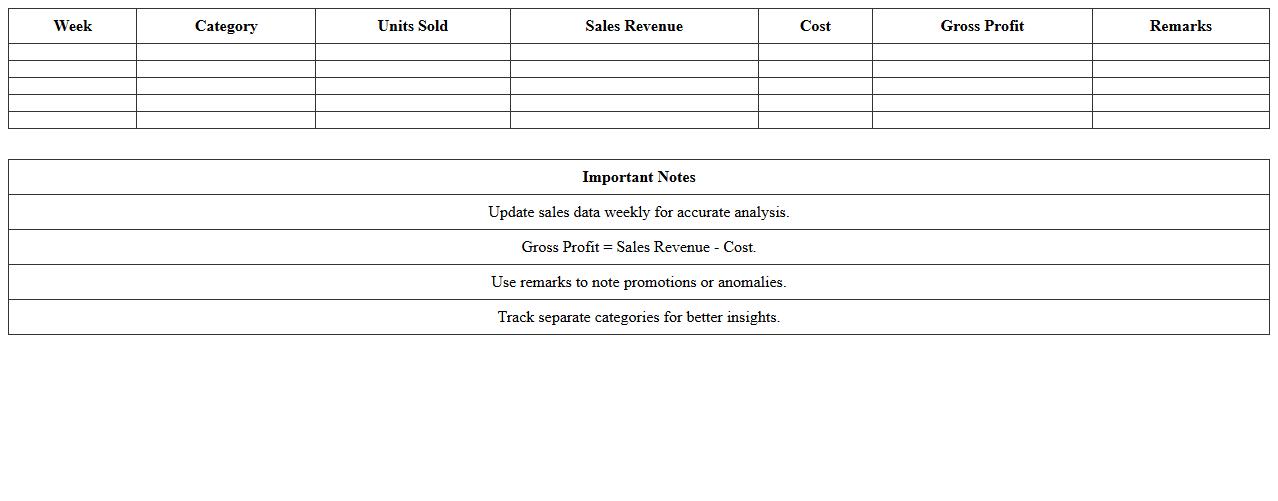
Weekly Category Sales Analysis Excel Template
The
Weekly Category Sales Analysis Excel Template is a structured spreadsheet designed to track, analyze, and compare sales data across different product categories on a weekly basis. It helps businesses identify trends, measure performance, and make informed decisions by visualizing category-specific sales volumes and growth rates. Using this template improves inventory management, marketing strategies, and overall sales optimization by providing clear insights into category dynamics.
Weekly Store Profitability Report Excel Template
The
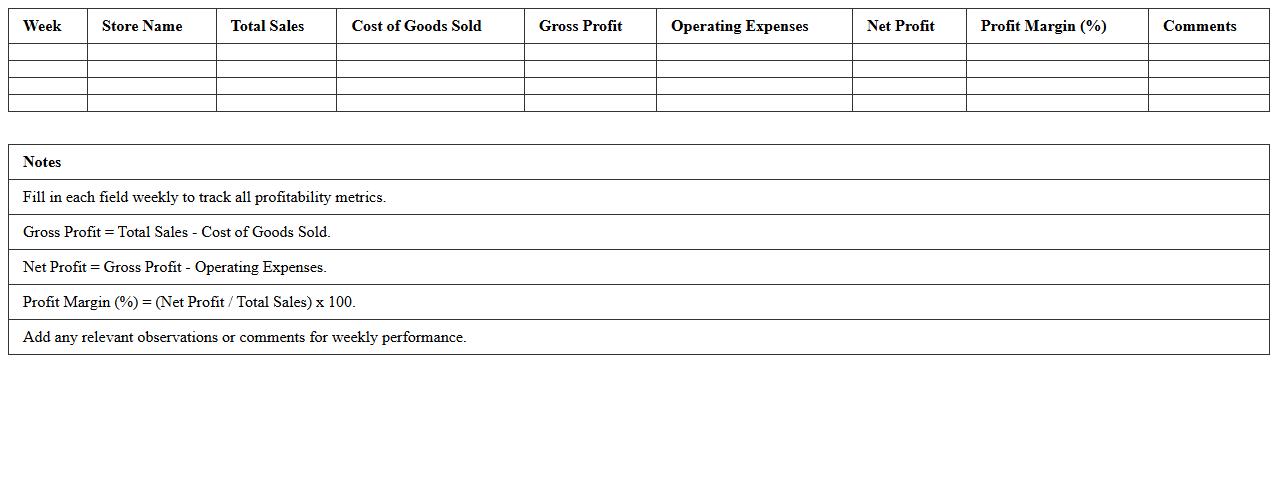
Weekly Store Profitability Report Excel Template is a comprehensive spreadsheet designed to track and analyze a store's financial performance on a weekly basis. This document enables users to monitor key metrics such as sales revenue, expenses, gross profit, and net profit, helping identify trends and areas for improvement. By providing clear, organized data visualization, it supports informed decision-making to enhance store profitability and operational efficiency.
How do you automate weekly sales data aggregation in Excel for multiple retail locations?
Use Power Query to import and transform sales data from multiple locations automatically. Set refresh schedules to update the data weekly without manual intervention. Consolidate all datasets into a centralized Excel Data Model for unified reporting.
What columns are essential for a retail store's Weekly Sales Report in Excel?
Include columns for Store ID, Product SKU, Sales Date, and Units Sold. Add Revenue and Discounts Applied to capture financial details accurately. Ensure Category and Region columns support segment analysis.
How can conditional formatting highlight underperforming products in a weekly sales report?
Apply conditional formatting rules based on sales thresholds to flag products below target. Use color scales or icon sets to visually emphasize underperformance at a glance. Automate updates by linking formatting to dynamic sales metrics.
Which Excel formulas best track week-over-week sales growth for each store?
Use the =(Current Week Sales - Previous Week Sales) / Previous Week Sales formula to calculate growth percentages. Combine with SUMIFS to aggregate weekly sales data by store efficiently. Implement IFERROR to handle missing or zero values gracefully.
How to integrate inventory turnover ratios into a weekly sales report Excel template?
Calculate inventory turnover by dividing Cost of Goods Sold by average inventory for the period. Add this metric as a dedicated column to the weekly sales report template. Use it to monitor stock efficiency alongside sales performance for each retail location.