The Social Media Analytics Report Excel Template for Marketing Agencies offers a streamlined way to track and measure campaign performance across multiple platforms. It features customizable dashboards, data visualization tools, and automated metrics calculation to enhance decision-making. This template empowers marketing agencies to present clear, actionable insights to clients efficiently.
Social Media Engagement Tracking Excel Template
The
Social Media Engagement Tracking Excel Template is a tool designed to monitor and analyze interactions such as likes, comments, shares, and follower growth across various social media platforms. It helps marketers and businesses measure the effectiveness of their social media strategies by providing clear data visualization and trend analysis. Utilizing this template enables informed decision-making to optimize content, increase audience engagement, and improve overall digital marketing performance.
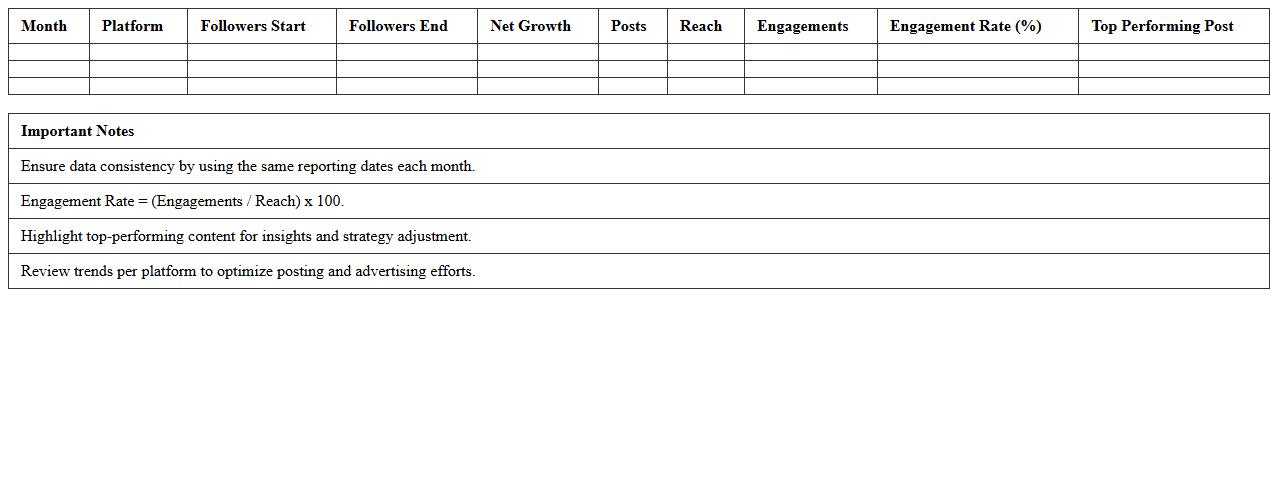
Monthly Social Media Performance Dashboard
The
Monthly Social Media Performance Dashboard document consolidates key metrics such as engagement rates, follower growth, and content reach into a comprehensive report, allowing businesses to monitor the effectiveness of their social media strategies. This dashboard provides actionable insights by highlighting trends and pinpointing high-performing content, enabling data-driven decision-making and strategic adjustments. Tracking these metrics consistently helps optimize marketing efforts, increase brand visibility, and improve customer interaction across platforms.
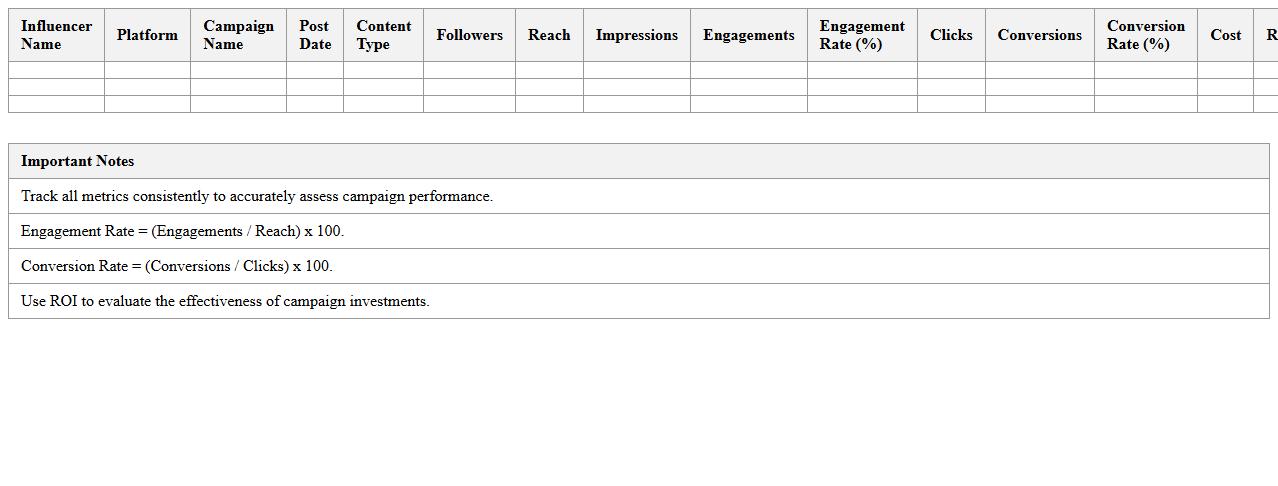
Influencer Campaign Results Excel Sheet
An
Influencer Campaign Results Excel Sheet is a detailed document designed to track and analyze the performance metrics of influencer marketing campaigns, including engagement rates, conversion data, and audience demographics. It helps marketers evaluate the effectiveness of influencer partnerships by consolidating data into an organized, easy-to-interpret format. This enables data-driven decision-making, optimizing future campaigns for higher ROI and improved brand visibility.
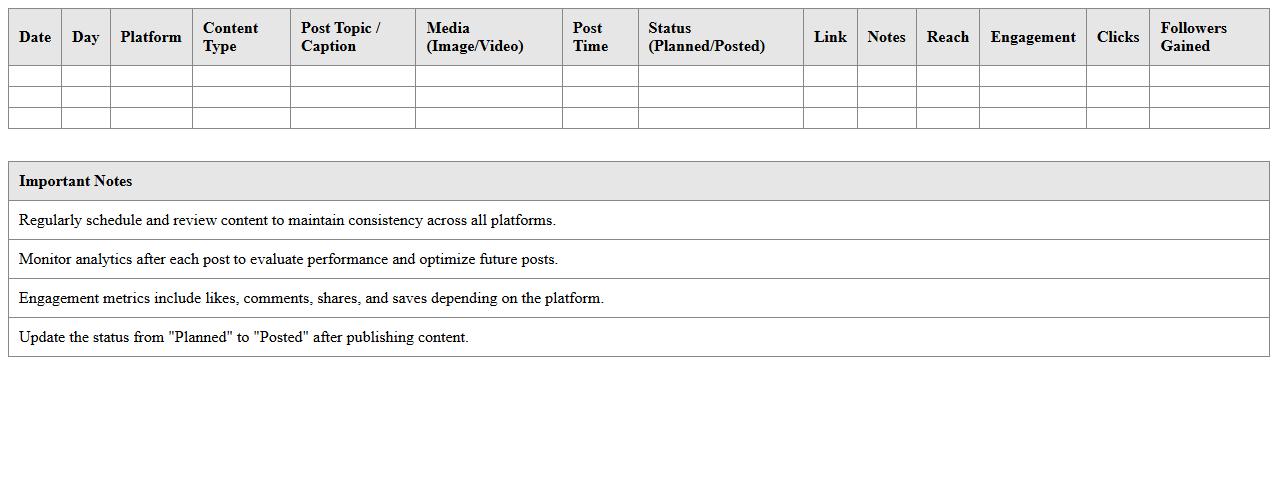
Social Media Content Calendar & Analytics Report
A
Social Media Content Calendar & Analytics Report is a strategic document that outlines scheduled posts and tracks performance metrics across social platforms. It helps businesses plan consistent content, align campaigns with marketing goals, and analyze engagement data to optimize future strategies. Using this report enhances efficiency, ensures timely posting, and provides insights necessary for improving audience reach and interaction.
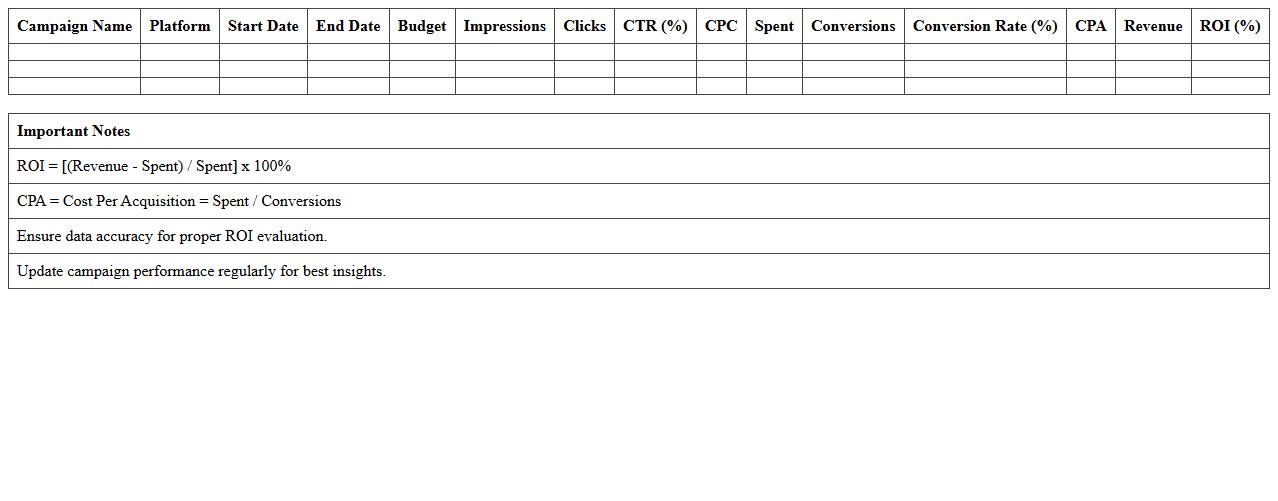
Paid Social ROI Analysis Excel Template
The
Paid Social ROI Analysis Excel Template is a powerful tool designed to track and evaluate the return on investment from paid social media campaigns by organizing data such as ad spend, conversions, and revenue. It enables marketers to easily calculate key performance metrics like cost per acquisition (CPA), return on ad spend (ROAS), and overall campaign profitability. This document streamlines decision-making, helping businesses optimize budgets and improve the effectiveness of their social advertising strategies.
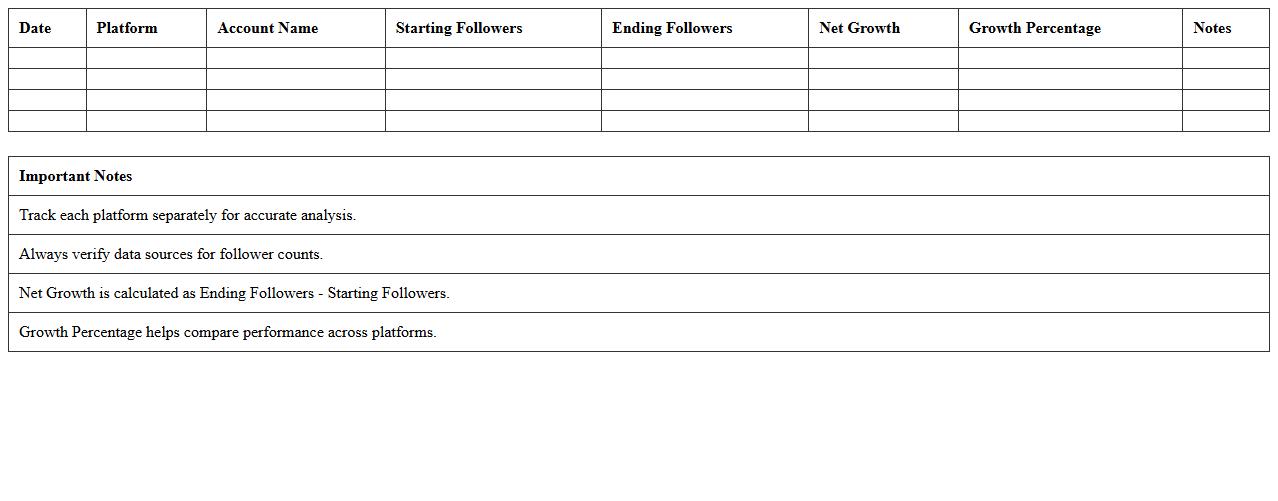
Multi-Platform Follower Growth Report
The
Multi-Platform Follower Growth Report tracks and analyzes audience growth trends across various social media channels in one comprehensive document. It provides valuable insights into follower demographics, engagement rates, and content performance, helping to identify which platforms and strategies drive the most significant growth. This report supports data-driven decision-making for marketing campaigns, enabling optimized resource allocation and improved overall social media presence.
Social Media Ad Spend and Conversion Tracker
The
Social Media Ad Spend and Conversion Tracker document systematically records advertising expenditures across platforms and links them directly to conversion outcomes, enabling precise measurement of campaign effectiveness. It assists businesses in optimizing budget allocation by identifying which ads yield the highest return on investment and pinpointing areas needing adjustment. This tool enhances decision-making by providing clear insights into the relationship between ad spend and customer actions, driving more strategic marketing efforts.
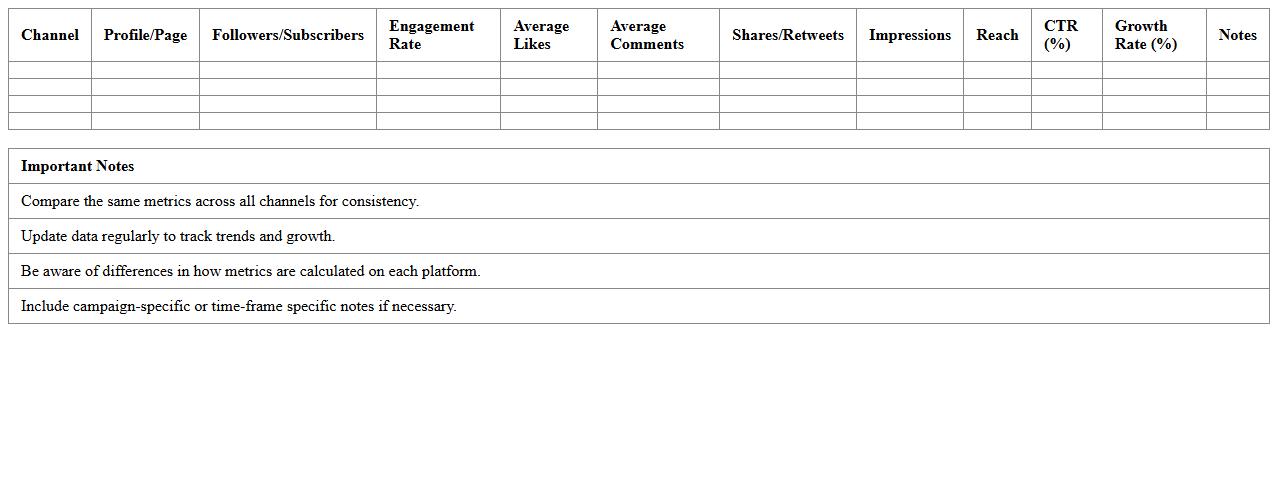
Cross-Channel Social Metrics Comparison Template
The Cross-Channel Social Metrics Comparison Template is a powerful tool designed to aggregate and analyze key performance indicators across multiple social media platforms in one unified view. It enables marketers and businesses to track engagement rates, follower growth, and content reach, providing clear insights into which channels perform best. By using this template, teams can make data-driven decisions to optimize social strategies, improve ROI, and allocate resources efficiently.
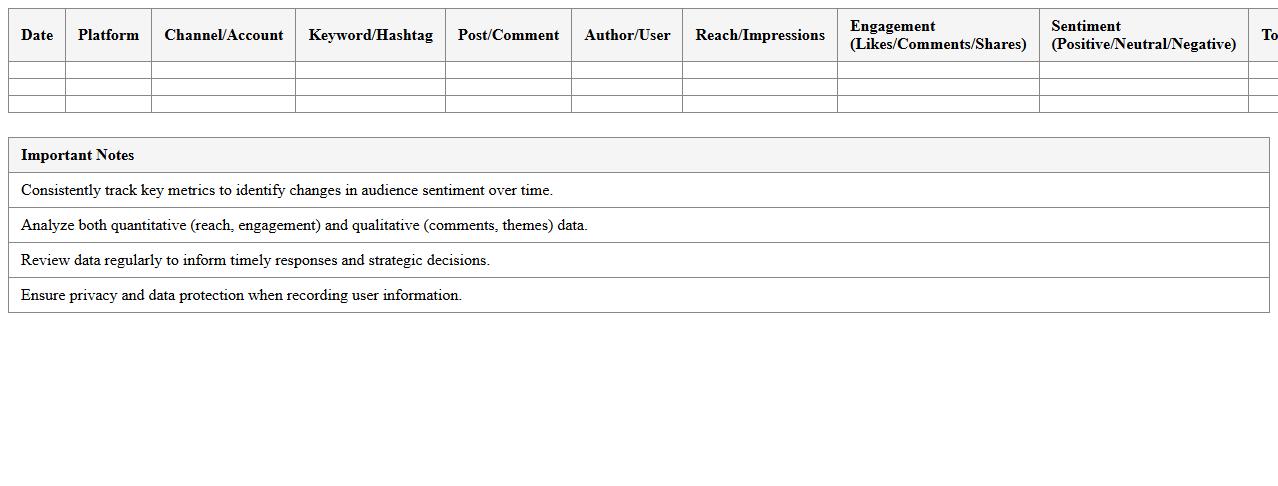
Social Listening & Sentiment Analysis Spreadsheet
A
Social Listening & Sentiment Analysis Spreadsheet document organizes and analyzes data from social media platforms, tracking mentions, keywords, and audience sentiments. It helps businesses identify trends, customer opinions, and potential issues in real-time, enabling informed decision-making and targeted marketing strategies. By consolidating this data visually, the spreadsheet improves efficiency in monitoring brand reputation and measuring campaign effectiveness.
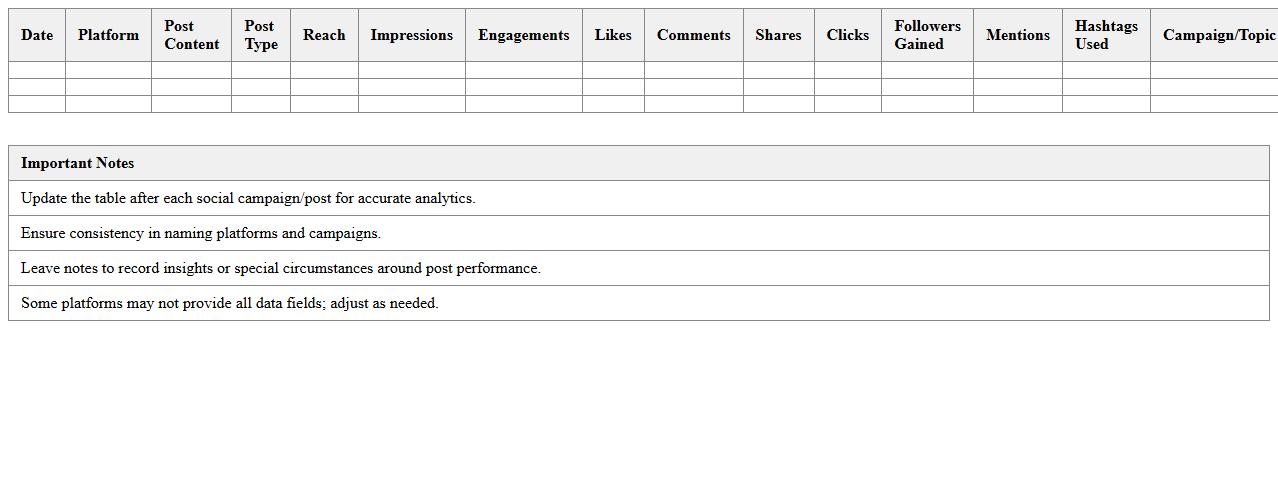
Comprehensive Social Posts Analytics Excel File
The
Comprehensive Social Posts Analytics Excel File document organizes data from various social media platforms to track engagement metrics, post performance, and audience behavior over time. It enables users to identify trends, measure the effectiveness of content strategies, and make data-driven decisions to enhance social media marketing efforts. By consolidating key analytics into a single, easy-to-navigate file, it streamlines reporting and improves the ability to optimize posts for maximum reach and interaction.
What key KPIs should be included in a Social Media Analytics Report Excel template for marketing agencies?
The essential KPIs to include are engagement rate, reach, and follower growth which provide insights into audience interaction and expansion. Additionally, tracking click-through rate (CTR) and conversion rate ensures effective campaign performance measurement. Sentiment score and audience demographics further enhance understanding of campaign impact and target alignment.
How can agencies automate data import from various social platforms into an Excel report?
Agencies can use tools like Microsoft Power Query or APIs to automate data import from platforms such as Facebook, Instagram, and Twitter directly into Excel. Setting up scheduled refreshes allows the report to stay up-to-date without manual input. Integration with third-party connectors like Supermetrics also streamlines data aggregation efficiently.
What Excel formulas or dashboards best visualize sentiment analysis for social campaigns?
Using formulas like AVERAGEIF or COUNTIF helps categorize and quantify sentiment data effectively. Creating dynamic dashboards with PivotTables and conditional formatting showcases sentiment trends over time with clear visual cues. Combining bar charts for positive, neutral, and negative sentiments provides a comprehensive overview at a glance.
How to structure an Excel report for tracking ROI across multiple social media channels?
A well-structured report groups data by channel, listing costs, conversions, and revenue for accurate ROI calculation. Using separate sheets for raw data and summary metrics ensures clarity and simplifies analysis. Incorporating calculated fields like ROI percentage and cost per acquisition helps compare channel efficiency precisely.
Which advanced Excel features enhance campaign performance comparison in monthly analytics reports?
Advanced features such as Power Pivot and slicers enable interactive filtering and multi-dimensional analysis for campaign performance comparison. Leveraging VBA macros automates repetitive tasks, increasing report generation speed. Using sparklines and data tables assists rapid visualization of trends and performance variances across time periods.
More Report Excel Templates