The Sales Trend Analysis Excel Template for E-commerce Stores enables businesses to track and visualize sales patterns over time, helping identify peak seasons and product performance. It features customizable charts and pivot tables to provide actionable insights that support data-driven decision making. This template enhances forecasting accuracy and optimizes inventory management for online retailers.
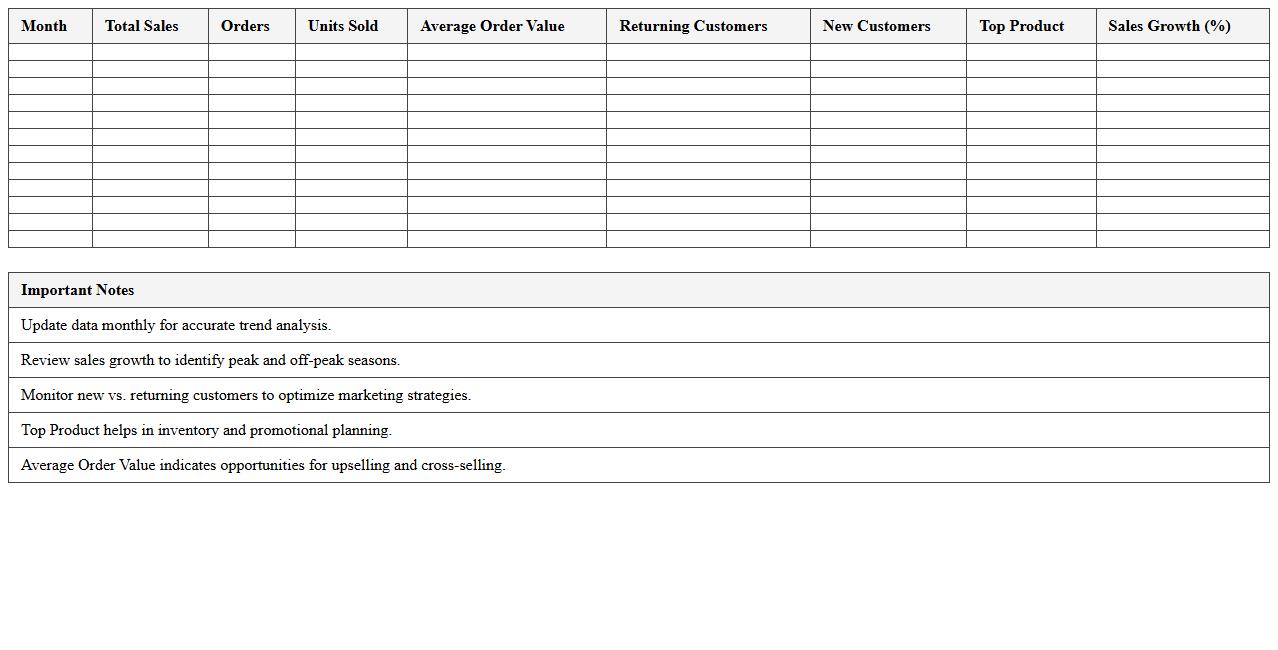
Monthly Sales Trend Dashboard Template for E-commerce
The
Monthly Sales Trend Dashboard Template for e-commerce is a powerful analytical tool designed to visualize and track sales performance over time. It consolidates critical data such as revenue, sales volume, and product category trends into easy-to-understand graphs and charts, enabling businesses to identify patterns and seasonality. This template helps e-commerce managers make informed decisions on marketing strategies, inventory management, and sales forecasting by providing actionable insights into monthly sales fluctuations.
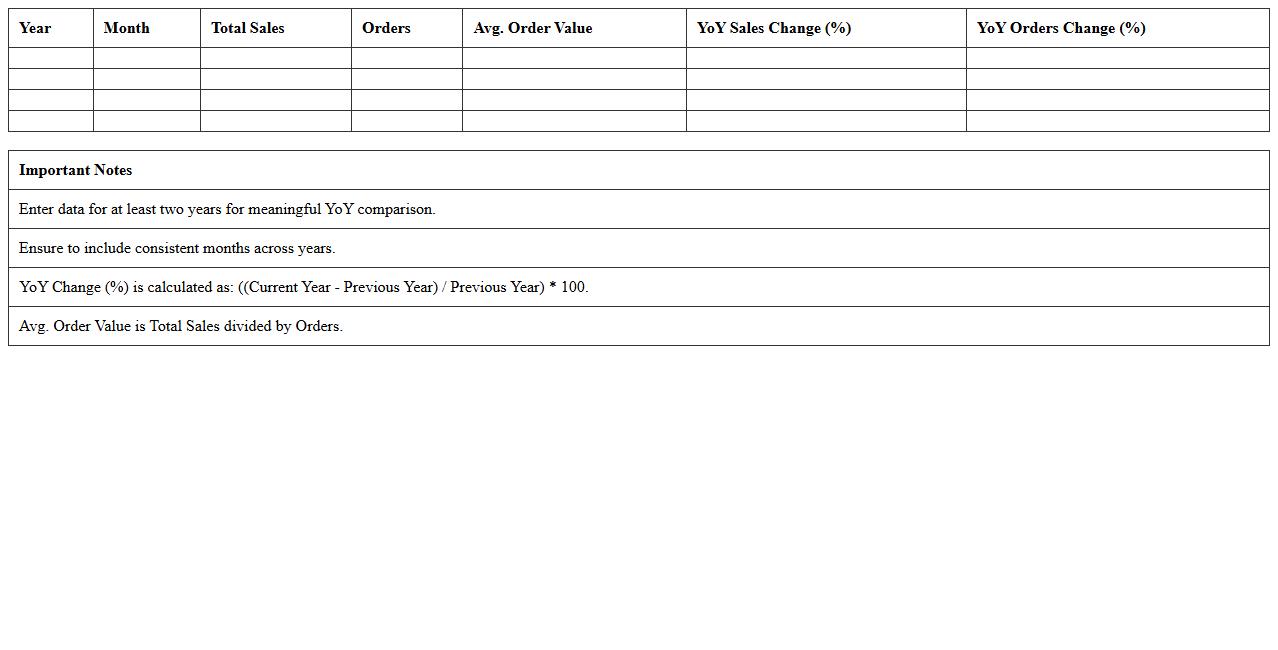
Year-over-Year E-commerce Sales Comparison Excel Sheet
A
Year-over-Year E-commerce Sales Comparison Excel Sheet is a tool designed to track and analyze sales performance by comparing monthly or quarterly revenue data from different years. It allows businesses to identify growth trends, seasonal patterns, and areas needing improvement by visualizing changes in sales figures over time. This document is essential for making data-driven decisions, optimizing marketing strategies, and forecasting future sales in the competitive e-commerce landscape.
Weekly Sales Performance Tracker for Online Stores
The
Weekly Sales Performance Tracker for online stores is a detailed document designed to monitor and analyze sales data on a weekly basis, providing insights into revenue trends, product performance, and customer buying patterns. It helps identify top-selling products, track promotional effectiveness, and manage inventory efficiently by highlighting fluctuations in sales. Utilizing this tracker enables businesses to make data-driven decisions, optimize marketing strategies, and improve overall profitability in a competitive e-commerce environment.
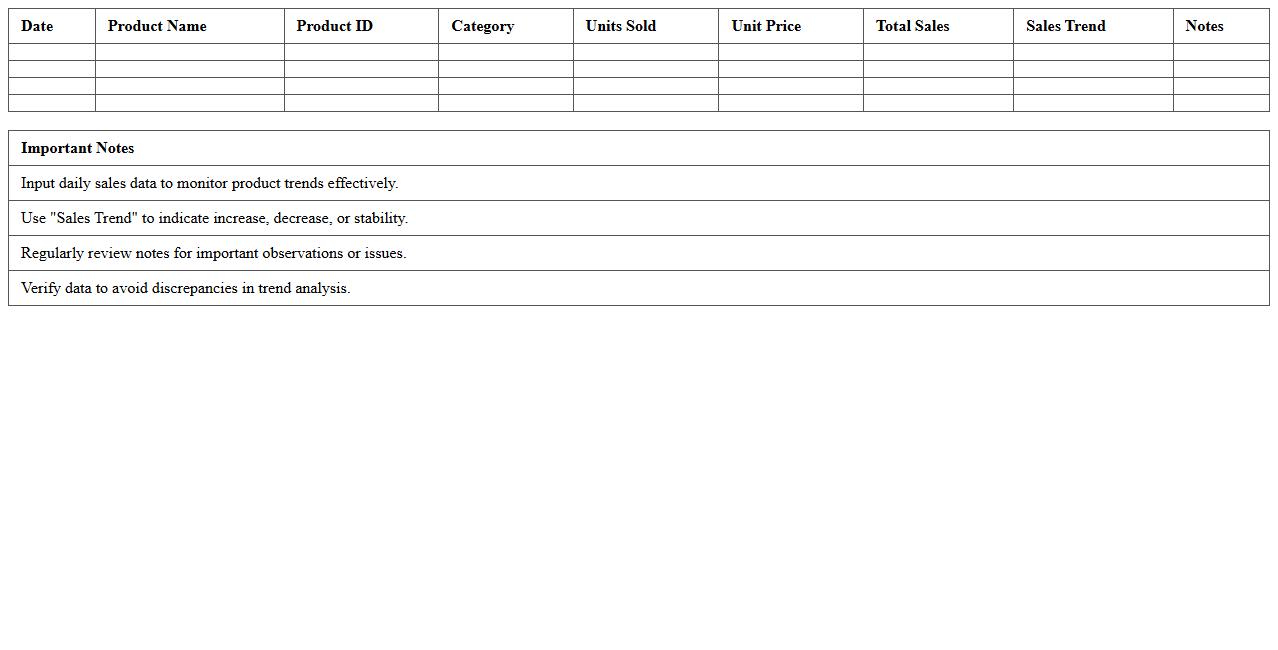
Daily Product Sales Trend Analysis Spreadsheet
A
Daily Product Sales Trend Analysis Spreadsheet document is a tool designed to track and visualize sales data over time, helping businesses identify patterns and fluctuations in product demand. By analyzing daily sales figures, companies can make informed decisions on inventory management, marketing strategies, and forecasting. This spreadsheet enhances operational efficiency and supports data-driven growth by highlighting trends that impact revenue and customer behavior.
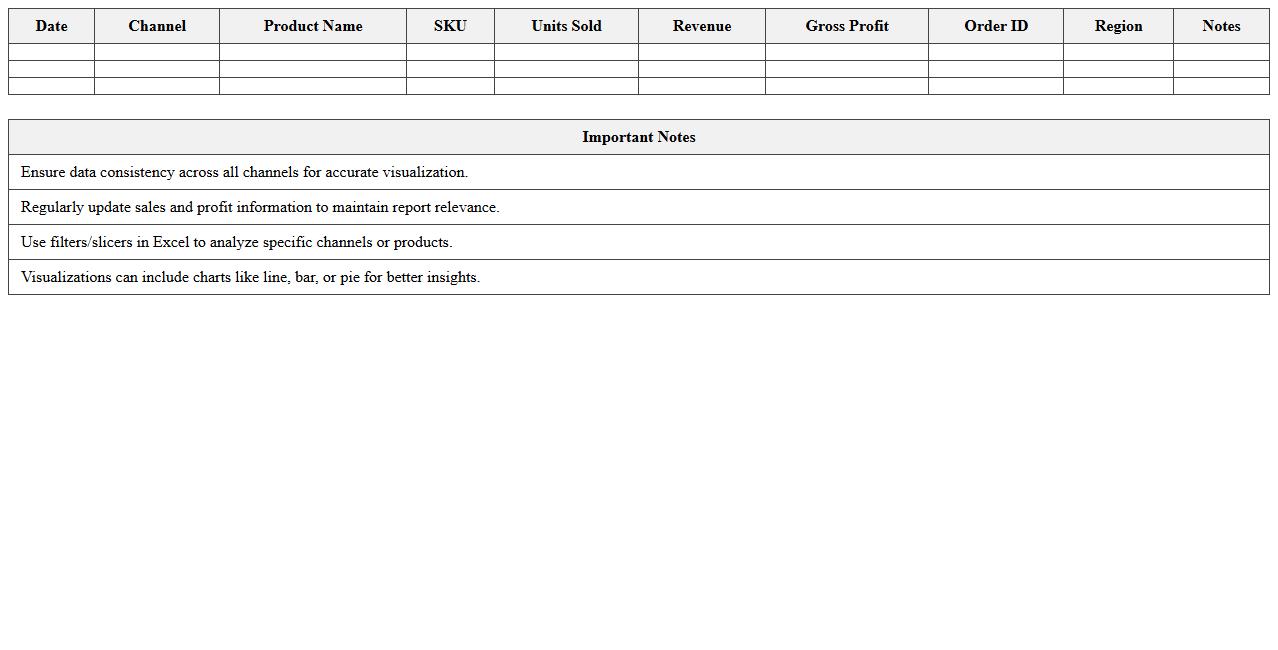
Multi-Channel Sales Data Visualization Excel Template
The
Multi-Channel Sales Data Visualization Excel Template is a structured spreadsheet designed to consolidate and display sales data from various platforms such as online stores, physical retail, and social media channels. It enables businesses to analyze performance metrics through interactive charts and graphs, facilitating clear insights into revenue trends, channel effectiveness, and customer behavior. By using this template, organizations can make data-driven decisions, optimize marketing strategies, and improve overall sales efficiency across multiple channels.
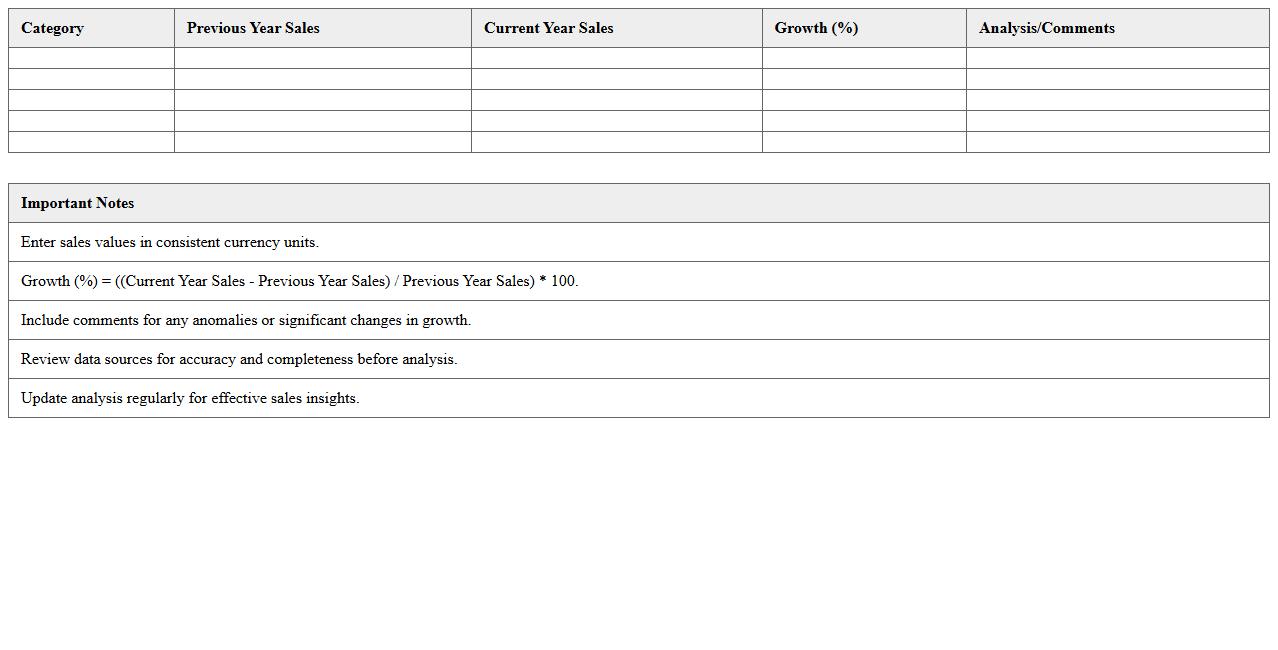
E-commerce Category Sales Growth Analysis Sheet
The
E-commerce Category Sales Growth Analysis Sheet is a detailed document that tracks and compares sales performance across different product categories over specific time periods. It helps businesses identify trends, measure growth rates, and pinpoint high-performing categories for strategic decision-making. Utilizing this analysis enhances inventory management, marketing efforts, and overall revenue optimization by focusing resources on fast-growing segments.
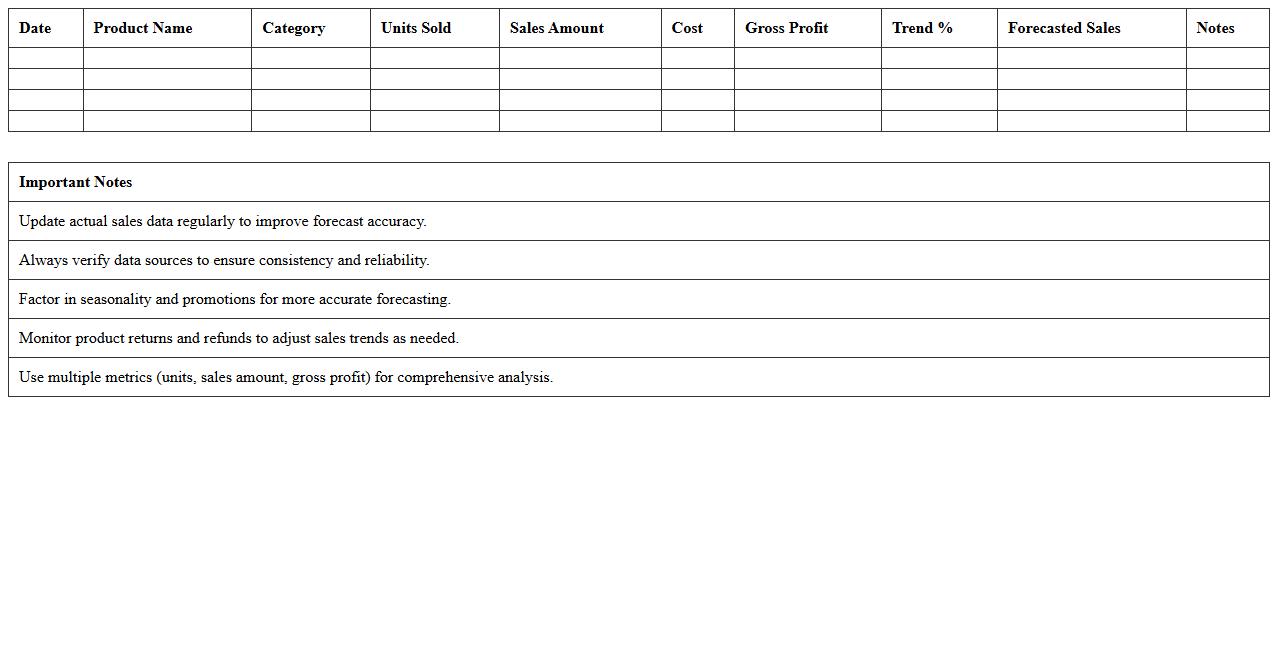
Sales Trend Forecasting Template for Online Retailers
A
Sales Trend Forecasting Template for Online Retailers is a structured tool designed to analyze historical sales data and predict future sales patterns. This document helps businesses identify emerging trends, optimize inventory management, and make informed marketing decisions. Utilizing this template enhances revenue projections and supports strategic planning for sustained growth in the competitive e-commerce market.
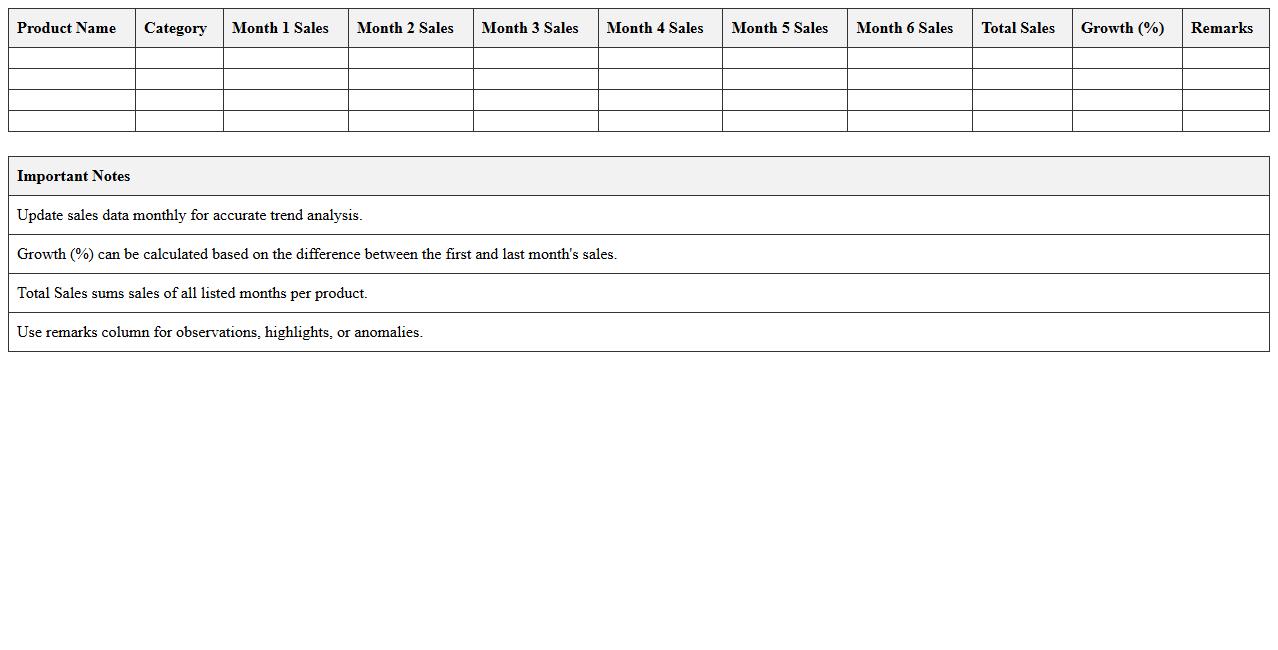
Product-wise Sales Trend Comparison Excel Format
The
Product-wise Sales Trend Comparison Excel Format document is designed to track and analyze sales performance across different products over specified time periods, enabling businesses to identify growth patterns and market demand shifts. This Excel template consolidates data into visual charts and tables, facilitating clear comparison and insightful decision-making for marketing strategies and inventory management. By using this format, companies can efficiently spot underperforming products and optimize resource allocation to boost overall profitability.
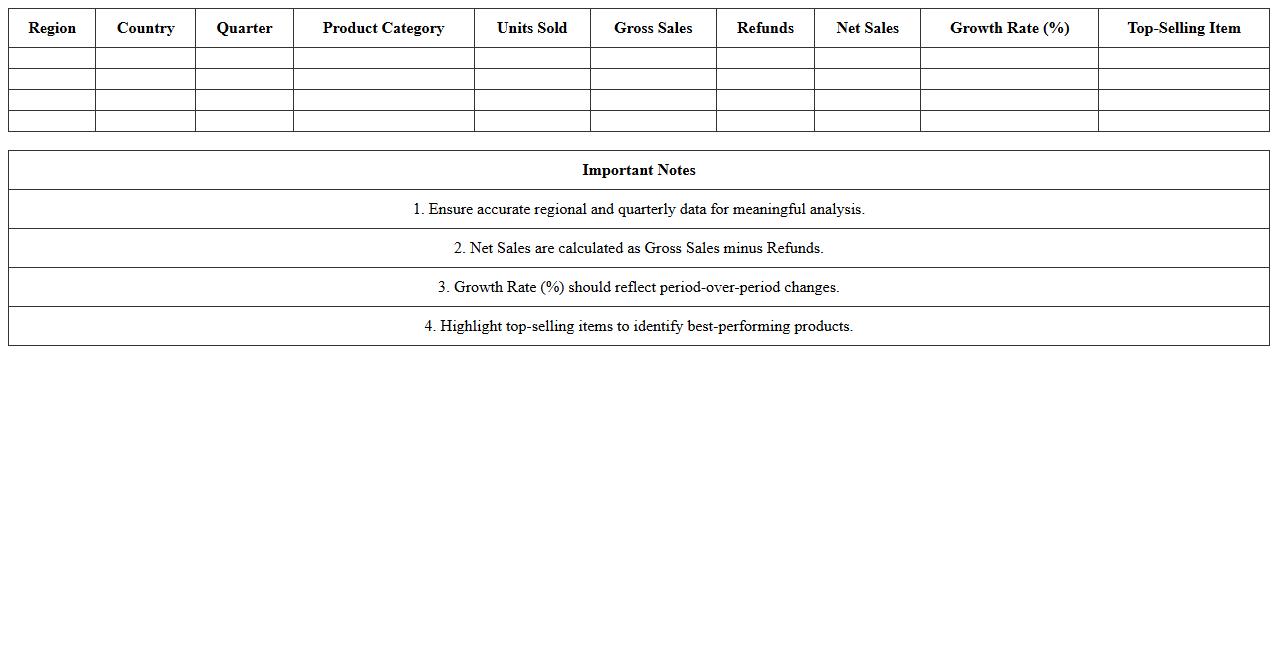
Regional E-commerce Sales Analysis Spreadsheet
The
Regional E-commerce Sales Analysis Spreadsheet is a powerful tool that organizes and tracks sales data across different geographical areas, enabling businesses to identify market trends and customer preferences efficiently. By analyzing region-specific sales performance, companies can allocate resources strategically, optimize marketing campaigns, and improve inventory management. This spreadsheet enhances decision-making by providing clear insights into regional demand variations, boosting overall sales and profitability.
Seasonal Sales Trend Chart Template for E-commerce
A
Seasonal Sales Trend Chart Template for e-commerce is a visual tool designed to track and analyze sales performance across different seasons or time periods throughout the year. It helps businesses identify peak sales periods, understand consumer behavior, and plan inventory or marketing strategies effectively. By leveraging this template, e-commerce managers can optimize sales forecasting and enhance decision-making to boost revenue during critical seasonal peaks.
How can I automate sales trend forecasting in Excel for SKU-level analysis?
To automate sales trend forecasting at the SKU level, use Excel's built-in FORECAST or FORECAST.ETS functions. These functions analyze historical sales data and predict future trends with seasonality accounted for. Coupling these with dynamic ranges and VBA macros can streamline SKU-level updates automatically.
What Excel formulas best identify seasonal sales fluctuations in e-commerce datasets?
The FORECAST.ETS function is ideal for detecting seasonal patterns in e-commerce sales data. Complement it with formulas like AVERAGEIFS and SUMIFS to isolate specific seasonal periods for granular analysis. These tools help reveal consistent sales peaks and dips tied to calendar cycles.
How do I create dynamic dashboards for monthly vs. yearly sales trends in Excel?
Create dynamic dashboards by linking PivotTables with slicers for easy filtering by month or year. Use named ranges and Excel Tables to ensure your data updates automatically with new inputs. Embed key performance indicators and charts for intuitive visual comparisons between monthly and yearly sales trends.
Which Excel charts most effectively visualize product category sales growth over time?
Line charts and stacked area charts best illustrate product category sales growth over time, showing trends and composition simultaneously. Combo charts can also juxtapose sales volume and growth rate effectively. These visualizations aid in quickly identifying high-performing categories and growth patterns.
How can I segment sales trend data by customer cohort in Excel for actionable insights?
Segment sales trends by defining customer cohorts using formulas like COUNTIFS combined with date criteria to group customers by acquisition period. Then analyze cohort performance with PivotTables and charts highlighting retention and sales behavior. This cohort segmentation provides actionable insights into customer lifecycle patterns.
More Analysis Excel Templates