Facebook Ads Performance Tracking Excel Template for E-commerce
The
Facebook Ads Performance Tracking Excel Template for e-commerce is a comprehensive tool designed to monitor and analyze the effectiveness of Facebook advertising campaigns. It enables users to track key metrics such as click-through rates, conversion rates, cost per acquisition, and return on ad spend, providing clear insights into campaign performance. This template helps e-commerce businesses optimize their ad budgets, improve targeting strategies, and make data-driven decisions to maximize sales and marketing ROI.
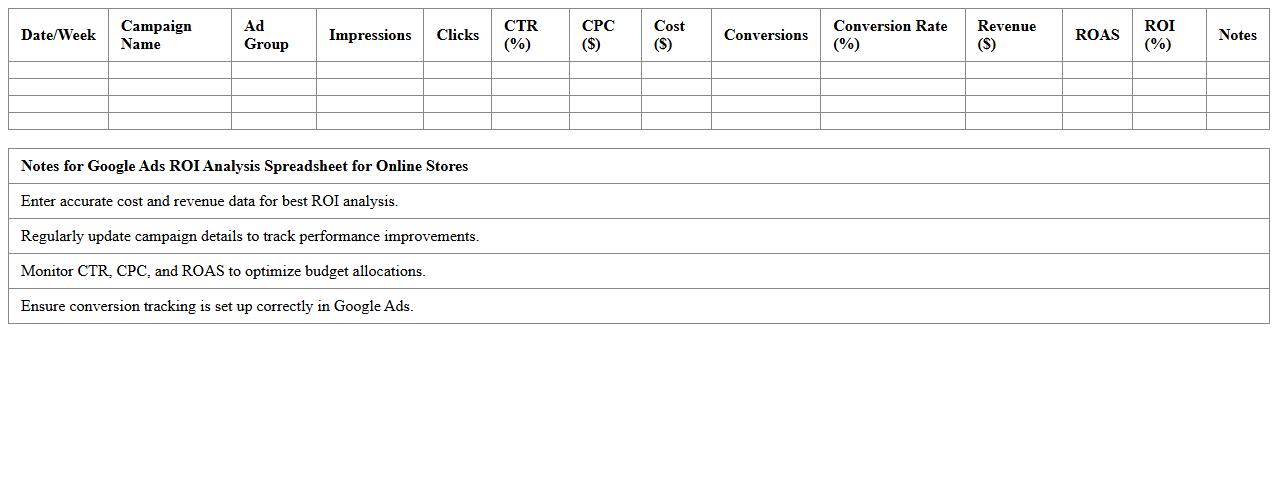
Google Ads ROI Analysis Spreadsheet for Online Stores
The
Google Ads ROI Analysis Spreadsheet for Online Stores is a powerful tool designed to track and evaluate the return on investment from Google Ads campaigns. It helps online retailers accurately measure ad spend against revenue generated, enabling data-driven decisions to optimize marketing budgets. By consolidating key metrics such as cost per click, conversion rate, and profit margins, this spreadsheet streamlines performance analysis and boosts profitability.
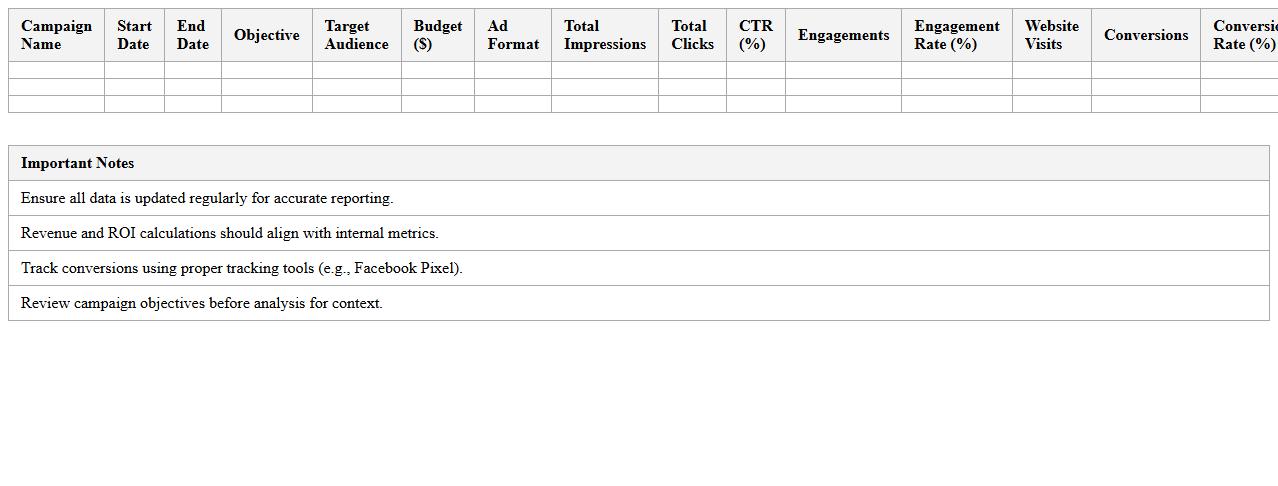
Instagram Campaign Results Excel Sheet for E-commerce Brands
The
Instagram Campaign Results Excel Sheet for e-commerce brands is a comprehensive tool designed to track, analyze, and optimize the performance of Instagram marketing campaigns. It systematically records key metrics such as engagement rates, click-through rates, conversion rates, and return on ad spend (ROAS), enabling brands to make data-driven decisions. This document helps businesses identify successful strategies, allocate budgets effectively, and enhance overall social media marketing ROI.
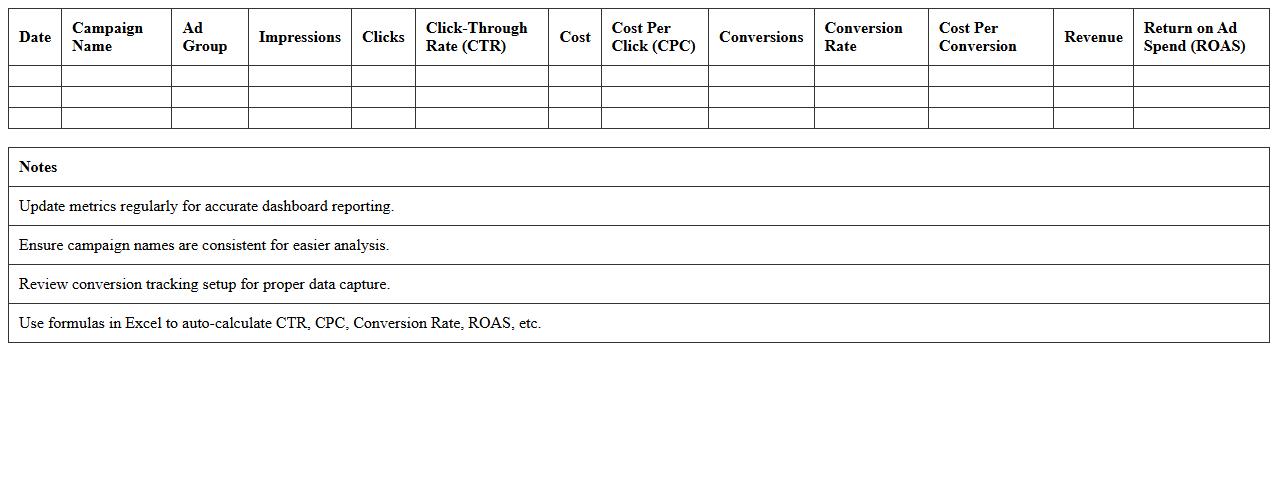
PPC Advertising Metrics Dashboard Excel Template
The
PPC Advertising Metrics Dashboard Excel Template is a powerful tool designed to track, analyze, and visualize pay-per-click campaign performance data in a user-friendly format. It consolidates essential metrics such as click-through rates, cost per click, conversion rates, and ROI, enabling marketers to make informed decisions quickly. This template enhances campaign optimization by providing clear insights, improving budget allocation, and identifying trends for better ad performance management.
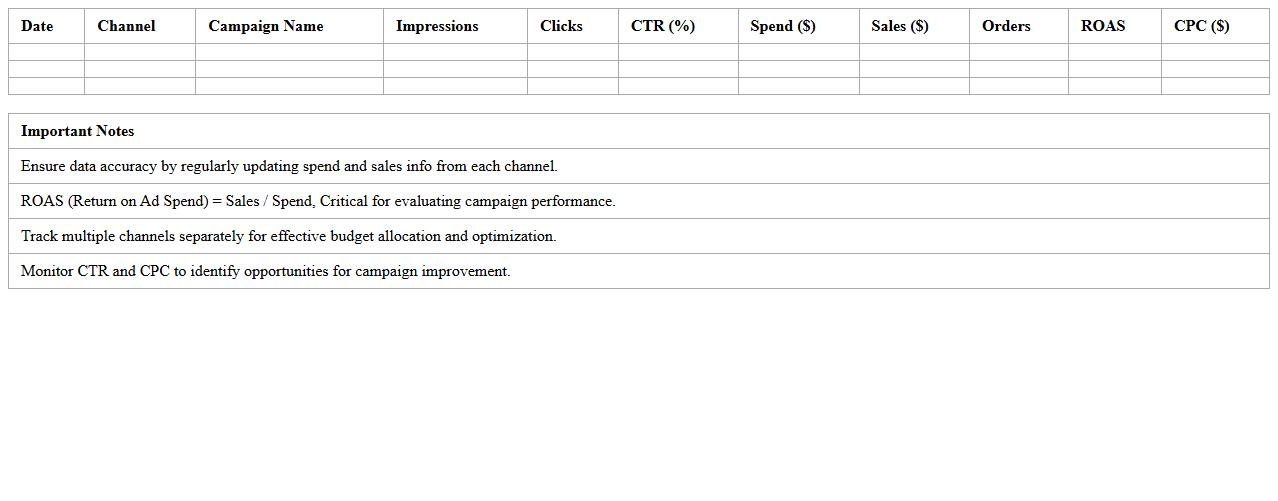
Multi-Channel Ad Spend Report Excel for E-commerce
The
Multi-Channel Ad Spend Report Excel for e-commerce consolidates advertising expenses from various platforms like Google Ads, Facebook, and Instagram into a single, organized spreadsheet. This report enables businesses to track spending patterns, measure ROI, and identify the most cost-effective channels to optimize marketing budgets. By providing clear visibility into multi-channel ad performance, it supports data-driven decisions that enhance overall advertising efficiency and profitability.
E-commerce Retargeting Ads Performance Tracker Excel
The
E-commerce Retargeting Ads Performance Tracker Excel document is a powerful tool designed to monitor and analyze the effectiveness of retargeting campaigns by capturing key metrics such as click-through rates, conversion rates, and return on ad spend (ROAS). It provides clear visualizations and organized data, enabling marketers to identify trends, optimize ad spend, and improve customer engagement through data-driven decisions. By using this tracker, businesses can enhance their advertising strategies, reduce wasted budget, and increase overall sales performance.
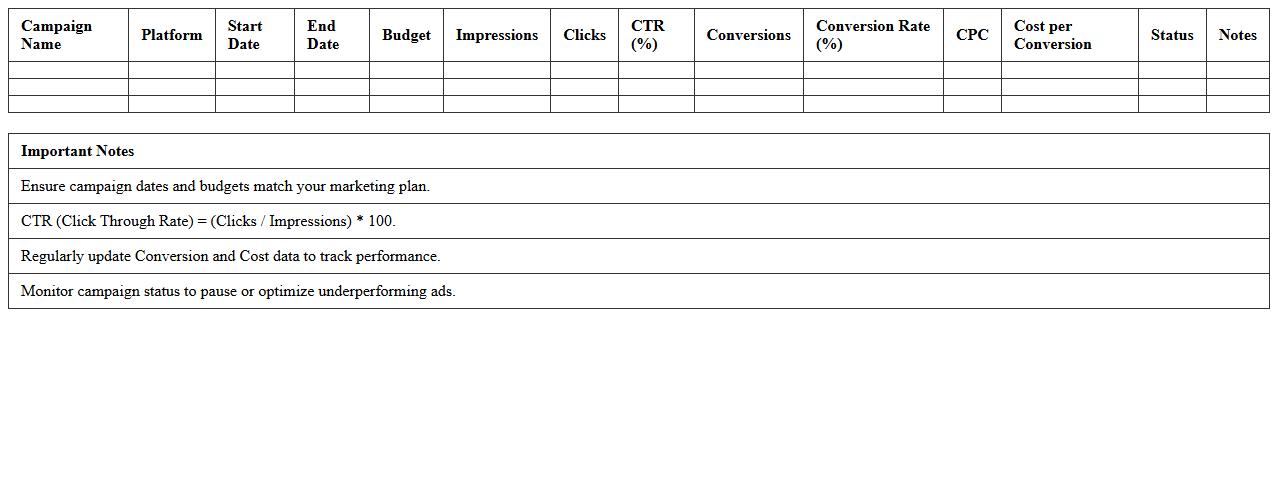
Social Media Ad Campaign Summary Excel Sheet
A
Social Media Ad Campaign Summary Excel Sheet is a structured document that consolidates key metrics such as impressions, clicks, click-through rates, conversions, and cost per acquisition from various social media platforms into a single, easy-to-analyze format. It enables marketers to track campaign performance, identify trends, and make data-driven decisions to optimize advertising spend and improve ROI. This tool streamlines reporting processes and enhances strategic planning across multiple social media channels.
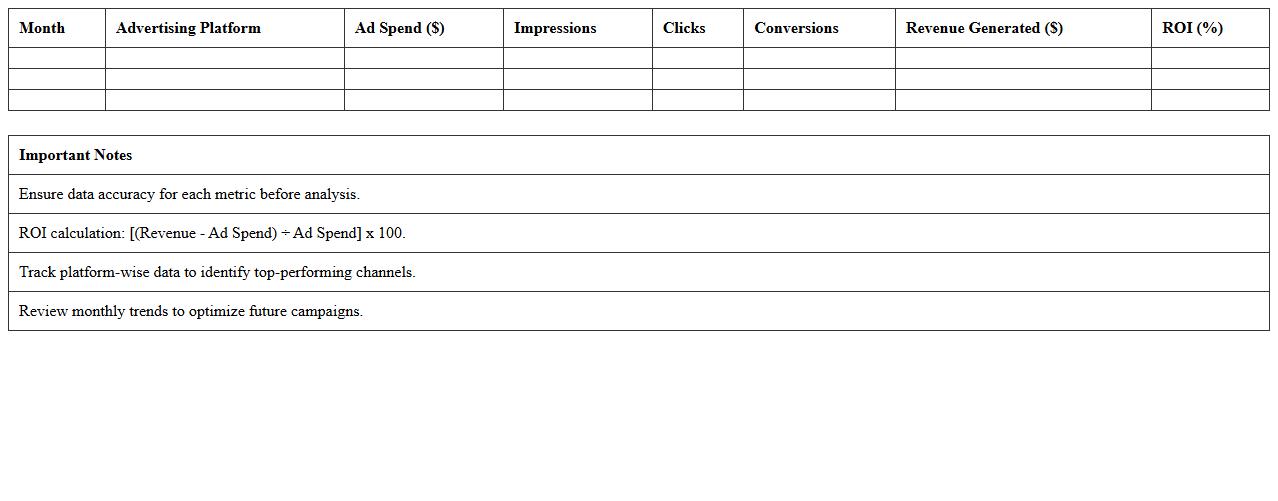
Monthly Advertising Cost vs Revenue Report Excel
The
Monthly Advertising Cost vs Revenue Report Excel document tracks the correlation between advertising expenditures and generated revenue on a monthly basis, enabling businesses to evaluate the financial effectiveness of their marketing campaigns. By analyzing this data, companies can identify trends, optimize budget allocation, and improve return on investment (ROI). It is essential for informed decision-making and strategic planning to maximize advertising impact and profitability.
Influencer Ad Performance Tracking Excel for Online Shops
The
Influencer Ad Performance Tracking Excel for online shops is a comprehensive tool designed to monitor and analyze the effectiveness of influencer marketing campaigns. It tracks key metrics such as engagement rates, conversion rates, click-through rates, and return on investment (ROI) to provide clear insights into which influencers drive the most value. Utilizing this document enables businesses to optimize their marketing strategies, allocate budgets efficiently, and improve overall campaign performance by focusing on high-impact influencer partnerships.
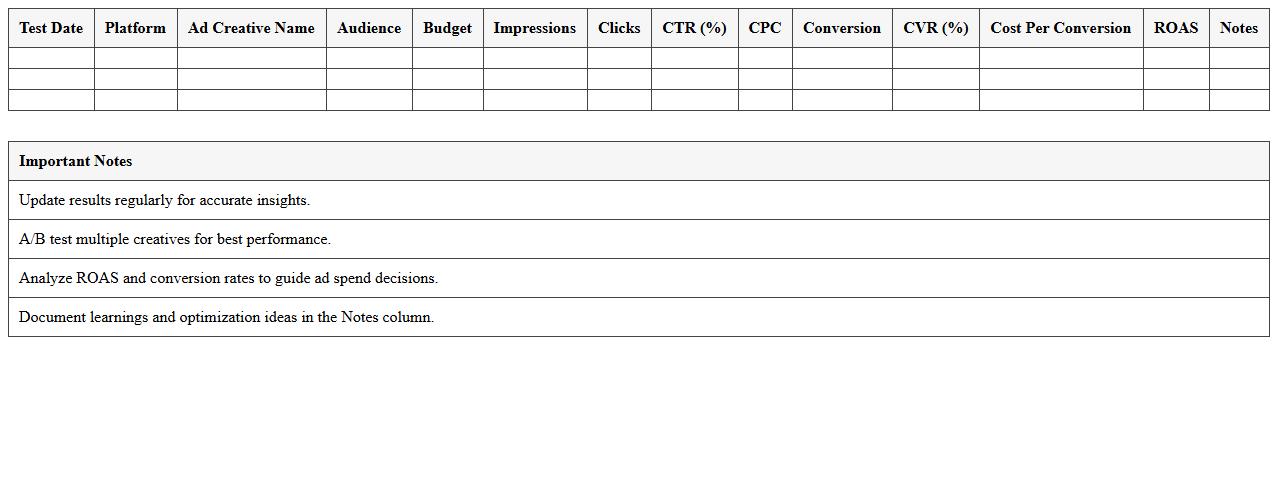
Ad Creative Testing Results Template for E-commerce Excel
An
Ad Creative Testing Results Template for E-commerce Excel document is designed to systematically track and analyze the performance of multiple ad creatives across campaigns. It enables marketers to compare metrics such as click-through rates, conversion rates, and return on ad spend to identify the highest-performing creatives. This organized approach facilitates data-driven decisions, optimizing ad spend and enhancing overall marketing effectiveness.
How can I automate UTM parameter tracking in the Advertising Performance Report Excel?
Automating UTM parameter tracking in Excel begins by importing your advertising data consistently. Use Excel's Power Query tool to connect and update UTM parameters automatically from your data sources. This approach streamlines tracking while minimizing errors in your Advertising Performance Report.
What formula best calculates ROAS per ad set in my e-commerce report?
The best formula to calculate ROAS (Return on Ad Spend) per ad set is: Revenue Generated / Ad Spend. Implement this formula in Excel by dividing the total revenue attributed to an ad set by its corresponding ad spend cell. This gives a clear, actionable metric for optimizing your e-commerce ad performance.
How do I segment ad spend by product category in Excel reports?
To segment ad spend by product category, ensure your data includes both spend and product category columns. Use Excel's filtering or Pivot Tables to group ad spend under each category. This segmentation helps in understanding resource allocation and optimizing marketing budgets effectively.
Which pivot table setup shows cross-channel campaign performance most effectively?
The most effective pivot table setup for cross-channel campaign performance includes channels as rows and performance metrics (like clicks, impressions, conversions) in columns. Add calculated fields for ROI or CTR to enhance insights. This layout facilitates quick comparison across channels to guide strategic decisions.
How can I visualize daily vs. lifetime customer value from ad campaigns in the spreadsheet?
Visualize daily vs. lifetime customer value by creating line charts or bar graphs in Excel. Plot daily values on one axis and lifetime values on another for clear comparison over time. Enhancing the chart with slicers or filters allows dynamic exploration of campaign impacts on customer value.