The Utility Provider Comparison Excel Template for Homeowners simplifies evaluating electricity, water, and gas services by organizing rates, usage, and contract terms in one place. This customizable template helps homeowners identify the most cost-effective utility options and optimize monthly expenses. Easy-to-use charts and summary tables provide clear insights for informed decision-making.
Electricity Provider Cost Comparison Excel Template
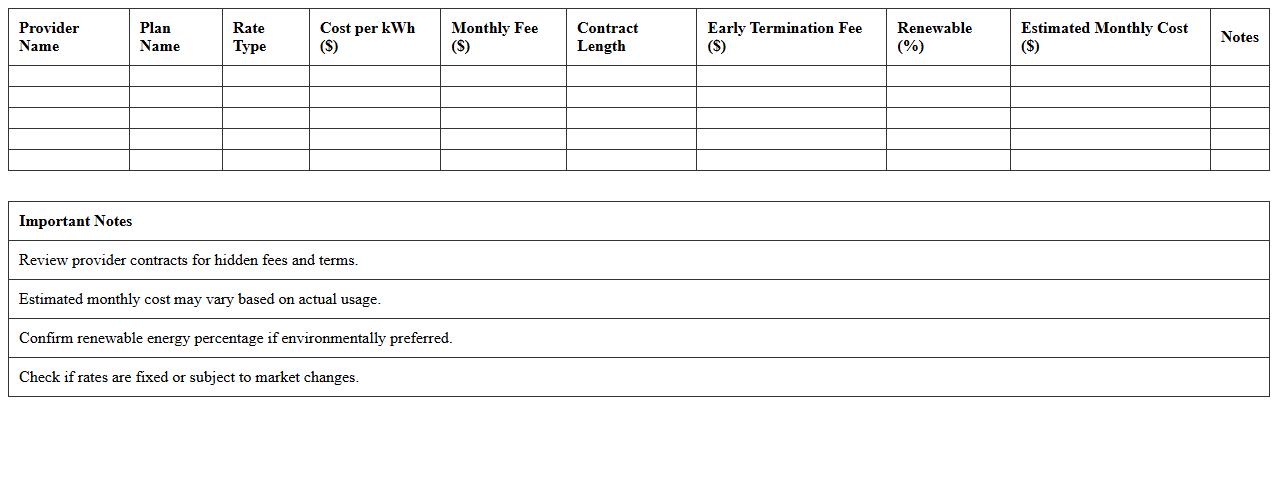
The
Electricity Provider Cost Comparison Excel Template document is a structured tool designed to analyze and compare electricity rates from various providers efficiently. It helps users identify the most cost-effective energy plans by organizing pricing data, usage patterns, and contract terms into clear, customizable spreadsheets. This template facilitates informed decision-making, potentially leading to significant savings on electricity bills by selecting the optimal provider based on individual consumption needs.
Water Utility Rate Analysis Excel Template
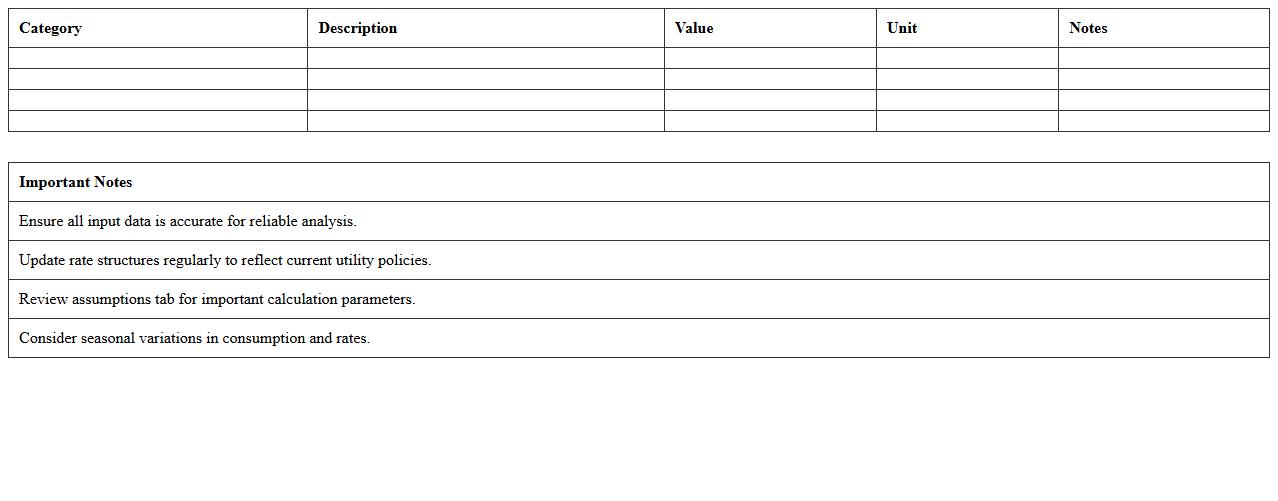
The
Water Utility Rate Analysis Excel Template is a comprehensive tool designed to evaluate and optimize water utility rates by analyzing consumption data, fixed and variable costs, and revenue requirements. It helps water utility managers and financial analysts model different rate structures, assess financial sustainability, and ensure compliance with regulatory standards. This template streamlines decision-making by providing clear insights into cost recovery and customer billing impacts.
Gas Supplier Tariff Comparison Spreadsheet
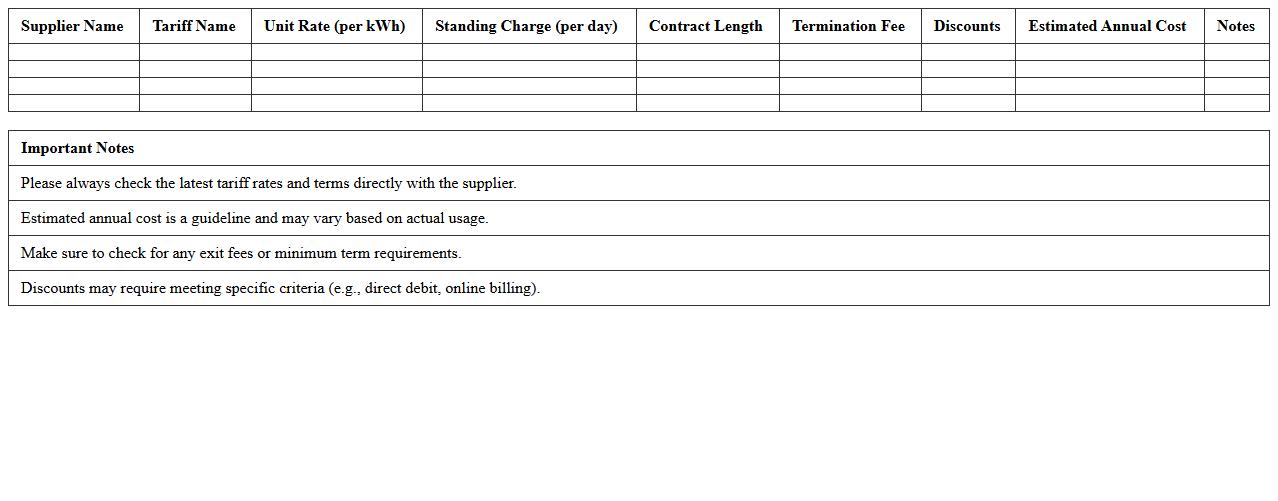
A
Gas Supplier Tariff Comparison Spreadsheet is a structured document that systematically organizes and compares various gas supplier rates, tariffs, and contract details. It enables consumers and businesses to analyze pricing, terms, and potential savings, helping them make informed decisions about their energy provider. By consolidating all relevant data, this spreadsheet simplifies the selection process, ensuring cost efficiency and transparency in energy purchases.
Internet Service Plan Comparison Excel Sheet
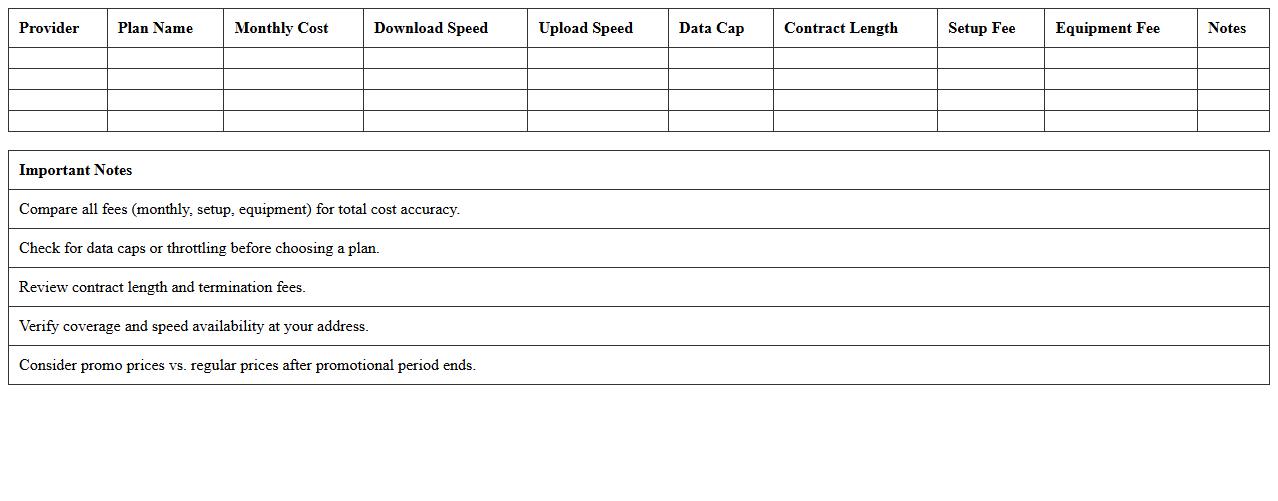
The
Internet Service Plan Comparison Excel Sheet is a comprehensive tool designed to organize and analyze various internet packages based on criteria like speed, cost, data limits, and provider reliability. It allows users to easily identify the most cost-effective and efficient internet plans tailored to their specific needs. This document enhances decision-making by providing a clear, side-by-side comparison that minimizes confusion and maximizes value from internet service investments.
Multi-Utility Provider Savings Tracker Excel
The
Multi-Utility Provider Savings Tracker Excel document is a comprehensive tool designed to monitor and compare expenses across multiple utility providers such as electricity, water, gas, and internet. It allows users to track monthly usage, identify cost-saving opportunities, and analyze provider rates to make informed decisions on switching or negotiating services. Utilizing this tracker enhances budgeting accuracy and promotes efficient management of household or business utility expenses.
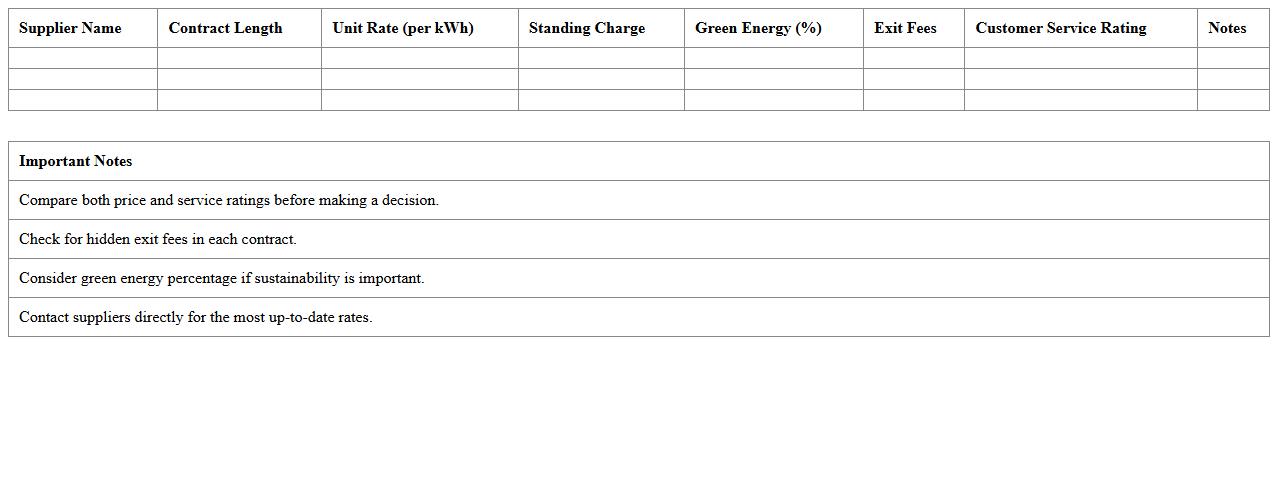
Home Energy Supplier Evaluation Excel Template
The
Home Energy Supplier Evaluation Excel Template is a structured spreadsheet designed to compare and assess various energy suppliers based on key criteria such as pricing, contract terms, customer service ratings, and renewable energy options. This template streamlines decision-making by organizing critical data into an easy-to-analyze format, helping users identify the most cost-effective and reliable energy provider for their household. By using this tool, individuals can optimize energy expenses while supporting sustainable choices aligned with their consumption needs.
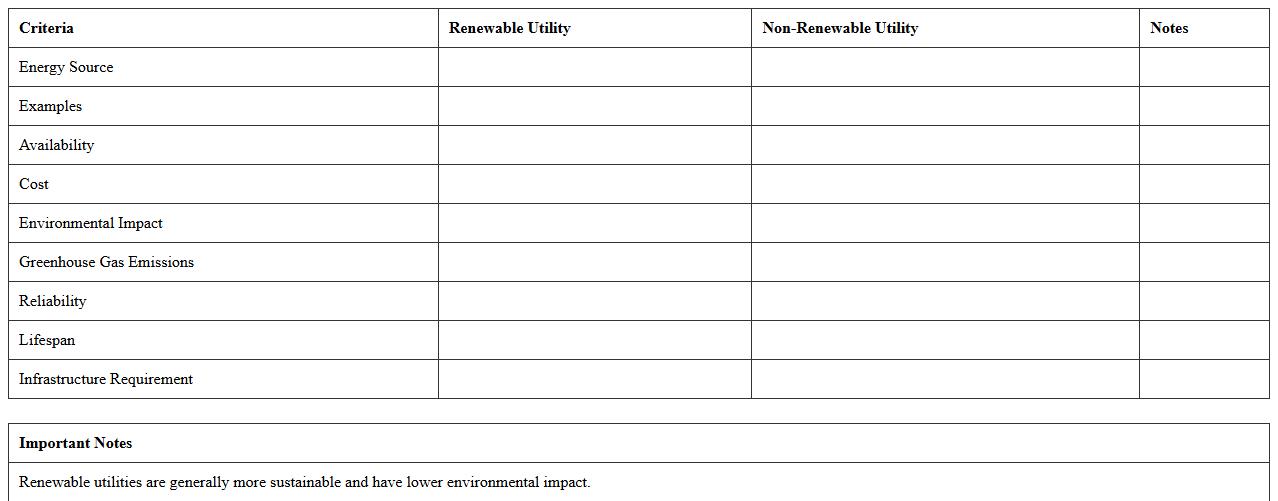
Renewable vs Non-Renewable Utility Comparison Sheet
The
Renewable vs Non-Renewable Utility Comparison Sheet document provides a detailed analysis of energy sources, contrasting their availability, environmental impact, and cost-effectiveness. It helps users make informed decisions by clearly presenting data on sustainability, efficiency, and long-term benefits. This comparison sheet is essential for businesses and individuals aiming to optimize energy use while minimizing ecological footprint and expenses.
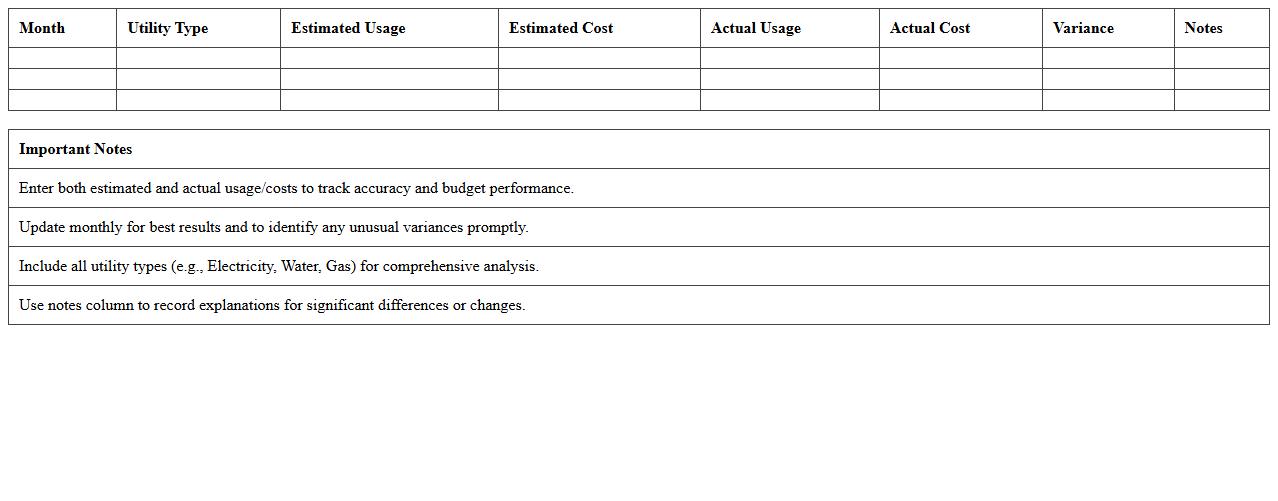
Utility Bill Forecasting Excel Spreadsheet
A
Utility Bill Forecasting Excel Spreadsheet is a tool designed to track, analyze, and predict future utility expenses such as electricity, water, and gas based on historical consumption data. It helps users identify patterns, manage budgets effectively, and anticipate potential cost increases, allowing for better financial planning. This document simplifies complex data into actionable insights, making it essential for households and businesses focused on reducing utility costs.
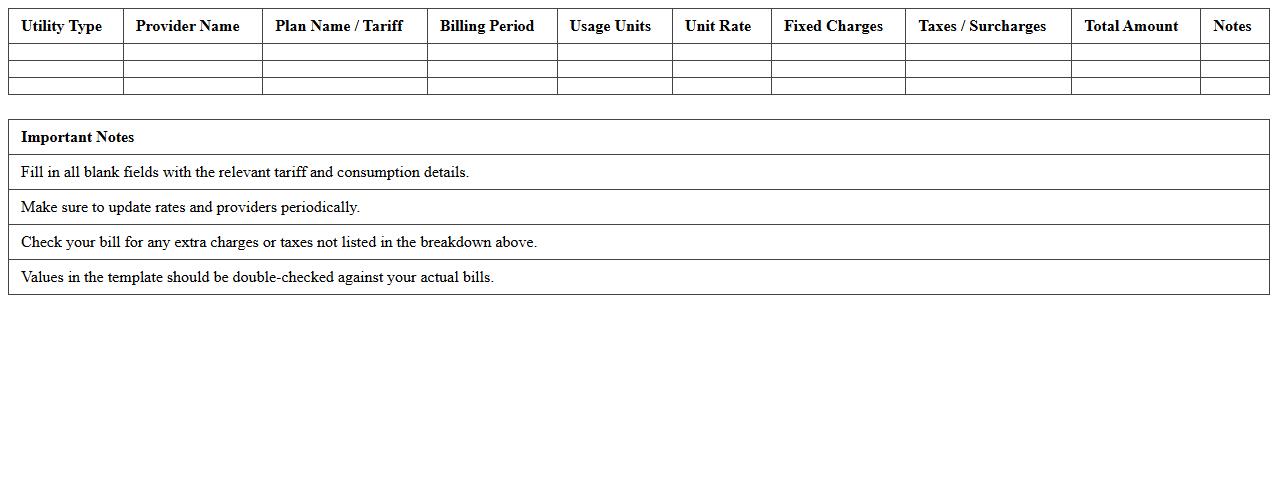
Home Utility Tariff Breakdown Excel Template
The
Home Utility Tariff Breakdown Excel Template is a structured spreadsheet designed to itemize and analyze various utility charges such as electricity, water, gas, and internet. This document enables users to track monthly consumption, compare tariff rates from different providers, and identify cost-saving opportunities efficiently. By organizing utility expenses clearly, it helps households manage budgets better and make informed decisions about optimizing their utility usage.
Regional Utility Provider Benchmark Excel Sheet
The
Regional Utility Provider Benchmark Excel Sheet document is a comprehensive tool designed to compare utility service providers across different regions based on key metrics such as pricing, service reliability, and customer satisfaction. It enables businesses and consumers to make informed decisions by analyzing data trends, cost efficiency, and performance benchmarks. Using this sheet helps optimize utility choices, reduce expenses, and improve operational efficiency in energy and water management.
Which Excel formulas best automate utility rate comparisons for homeowners?
SUMIF and VLOOKUP formulas are essential for automating utility rate comparisons in Excel. SUMIF helps aggregate costs based on specific criteria, such as provider or month, simplifying analysis. VLOOKUP allows homeowners to retrieve rates quickly, comparing different providers side by side.
How can conditional formatting highlight cost-saving providers in the spreadsheet?
Conditional formatting uses color scales or data bars to visually emphasize the lowest utility rates. By setting rules that highlight cells below a certain threshold, homeowners can instantly identify the most cost-effective providers. This dynamic visual cue saves time and enhances decision-making processes.
What custom columns help track seasonal utility fluctuations effectively?
Adding month and season columns allows homeowners to categorize utility data according to time periods. Custom columns like percentage change between months help highlight significant fluctuations. These enhancements enable a detailed understanding of seasonal trends and consumption patterns.
How can data validation improve accuracy in utility provider entries?
Data validation restricts input by creating a drop-down list of approved utility providers, reducing errors and inconsistencies. This feature enhances data integrity by ensuring only valid entries are recorded. Accurate provider information leads to more reliable utility expense analysis.
What chart types visualize yearly utility expenses most clearly for homeowners?
Line charts and stacked column charts are ideal for visualizing yearly utility expenses in Excel. Line charts illustrate trends over time, while stacked columns break down total costs by provider or utility type. These visualizations simplify complex data, making it easier for homeowners to spot patterns and optimize spending.
More Comparison Excel Templates