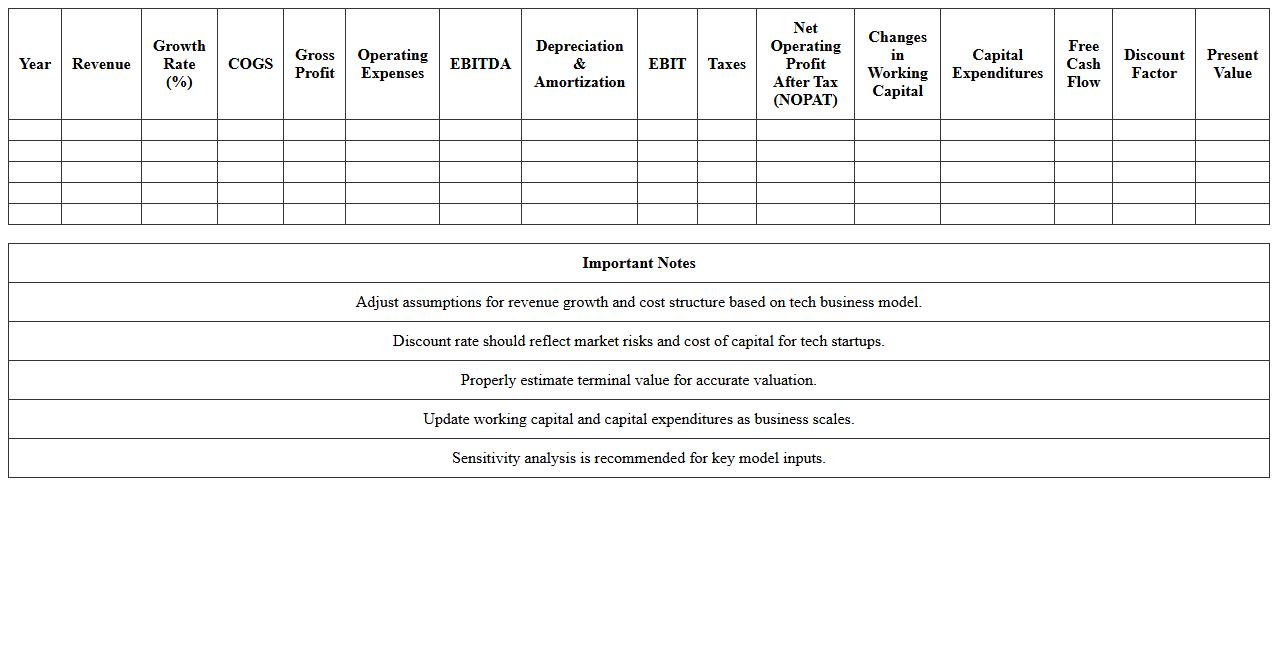
The Discounted Cash Flow Analysis Excel Template for Tech Startups provides a comprehensive tool to project future cash flows and evaluate the intrinsic value of emerging technology companies. This template incorporates customizable inputs tailored to the unique growth rates, capital expenditures, and risk factors typical in the tech startup sector, enabling precise financial forecasting. It streamlines the valuation process by automating discount rate calculations and sensitivity analysis, facilitating informed investment decisions.
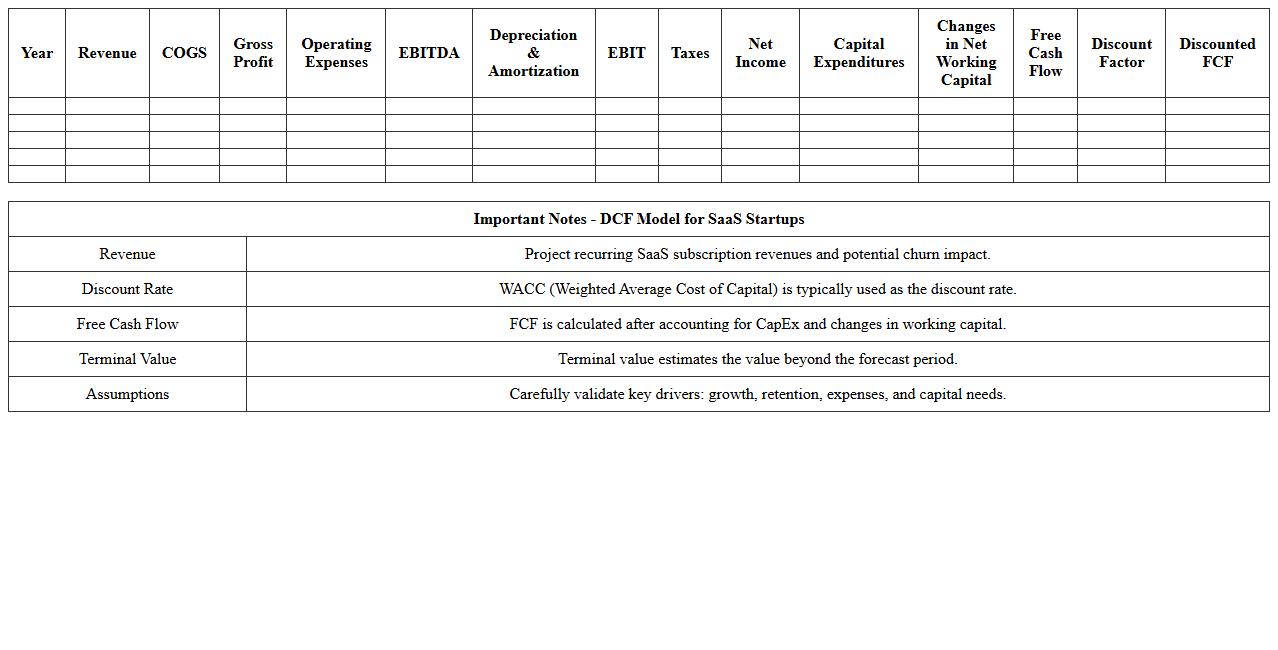
DCF Model for SaaS Startups Excel Template
The
DCF Model for SaaS Startups Excel Template is a financial forecasting tool designed to calculate the intrinsic value of a SaaS company by estimating future cash flows and discounting them to present value. This template integrates key SaaS metrics such as monthly recurring revenue (MRR), churn rate, customer acquisition cost (CAC), and lifetime value (LTV) to provide an accurate valuation framework. Using this model helps founders and investors make informed decisions based on realistic growth projections and financial health analysis.
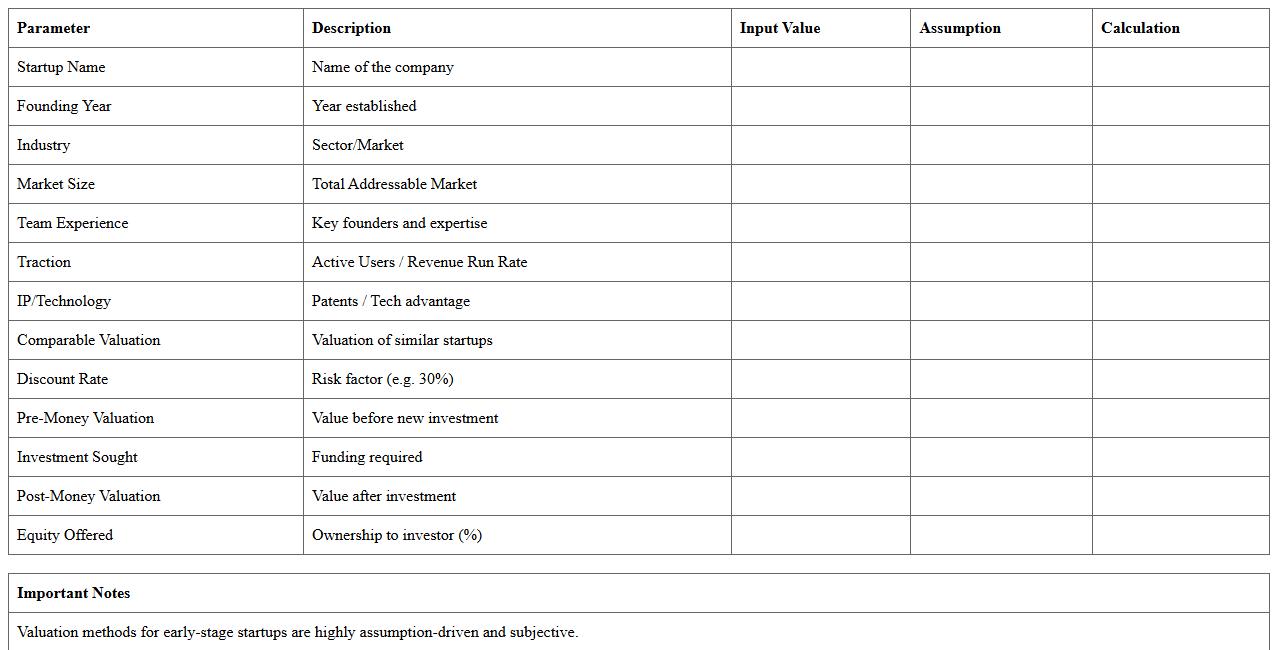
Early-Stage Tech Startup Valuation Excel Sheet
An
Early-Stage Tech Startup Valuation Excel Sheet document is a financial modeling tool designed to estimate the value of a startup based on key metrics like projected revenue, market size, and growth rates. This sheet helps founders and investors make data-driven decisions by providing a clear, quantifiable overview of potential future valuation. It streamlines complex valuation processes and enhances transparency during funding rounds or strategic planning.
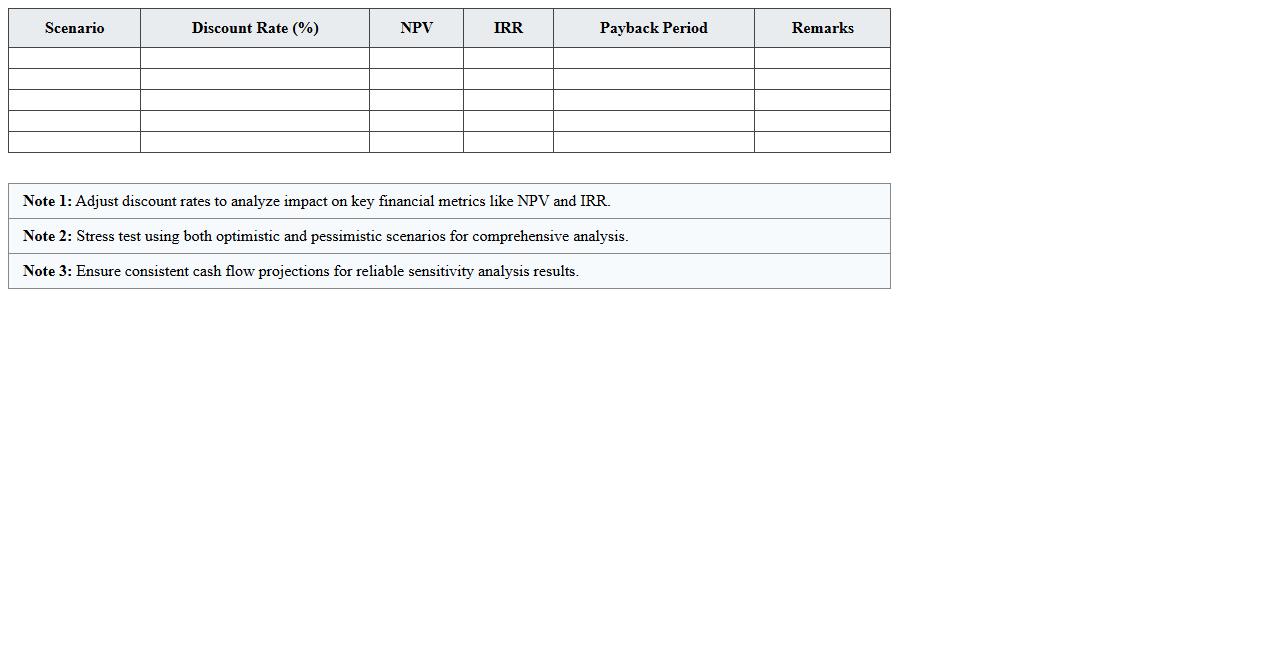
Discount Rate Sensitivity Analysis Excel Template
The
Discount Rate Sensitivity Analysis Excel Template is a powerful financial tool designed to evaluate how changes in discount rates impact the present value of cash flows or investment projects. This template helps users visualize potential risks and returns by adjusting discount rates, enabling informed decision-making in capital budgeting and project valuation. Its structured format simplifies complex calculations, making it essential for analysts aiming to optimize investment strategies and accurately assess financial sensitivity.
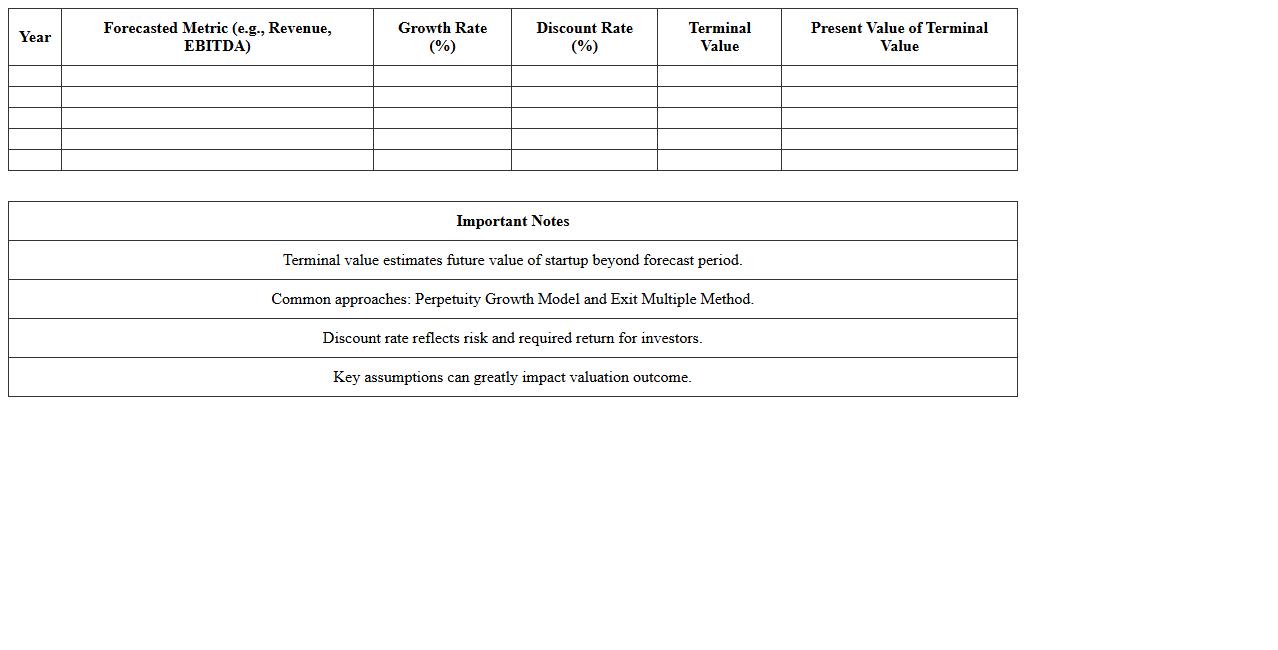
Terminal Value Calculation Worksheet for Startups
The
Terminal Value Calculation Worksheet for startups is a financial tool designed to estimate the future value of a company beyond the forecast period, capturing the bulk of its long-term worth. This worksheet assists entrepreneurs and investors in determining the startup's potential exit value based on projected cash flows and growth rates. Utilizing this document enhances strategic decision-making by providing a quantifiable measure of the startup's sustained profitability and investment attractiveness.
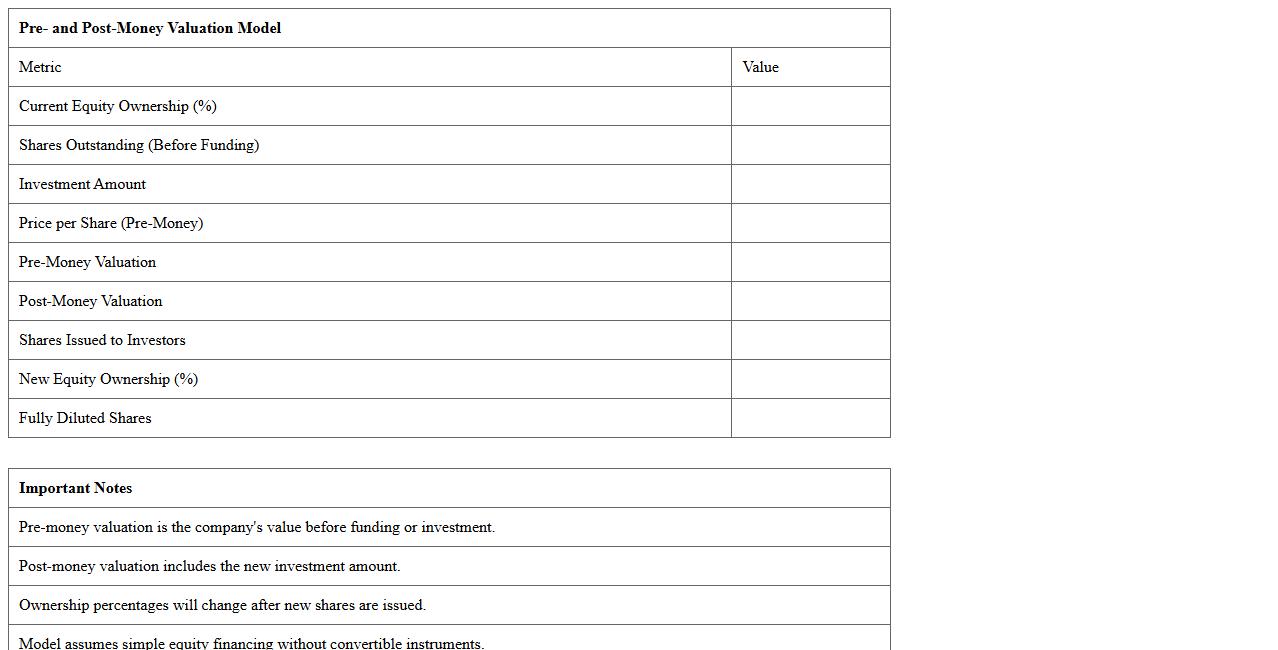
Pre- and Post-Money Valuation Model Excel
The
Pre- and Post-Money Valuation Model Excel document is a financial tool designed to calculate a company's value before and after external funding rounds, providing key metrics for equity distribution and investment analysis. It helps startups, investors, and financial analysts make informed decisions by projecting ownership stakes, dilution effects, and funding impacts in a clear and customizable format. Using this model streamlines scenario planning for funding rounds, ensuring transparency and strategic growth forecasting.
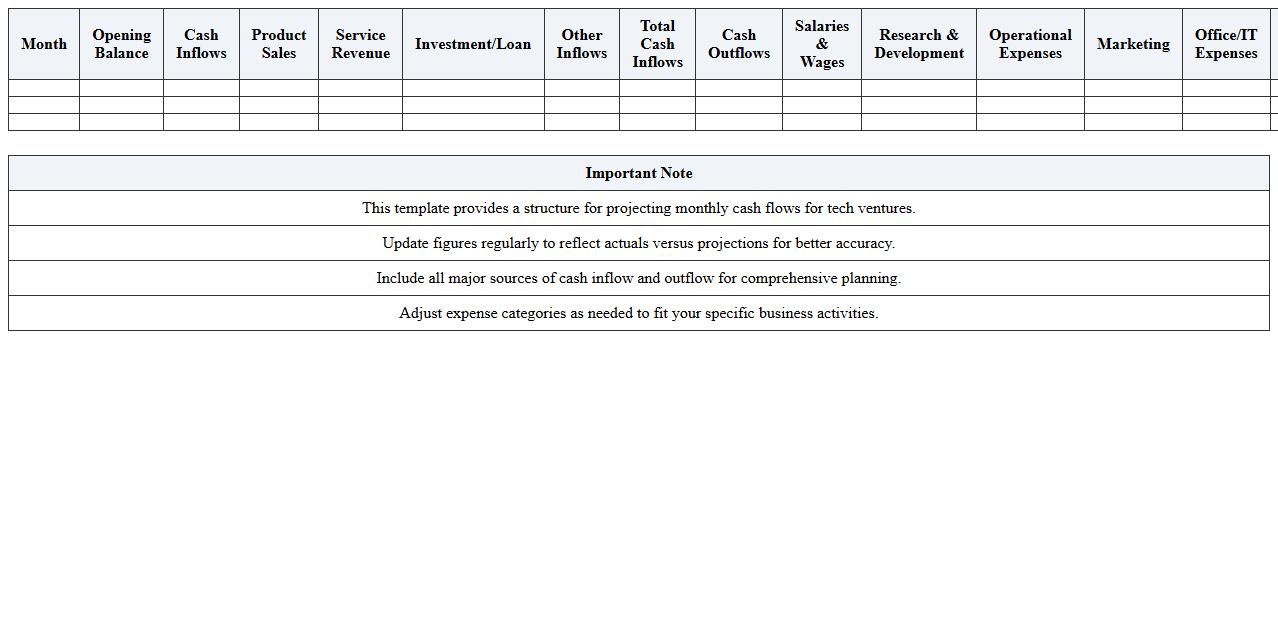
Cash Flow Projection Template for Tech Ventures
A
Cash Flow Projection Template for Tech Ventures is a financial planning tool designed to forecast the inflow and outflow of cash within a technology startup or company. It helps entrepreneurs and investors anticipate funding needs, manage expenses, and ensure sustainable growth by providing a clear picture of liquidity over time. Using this template allows tech ventures to make informed decisions, avoid cash shortages, and strategically plan for operational and development expenses.
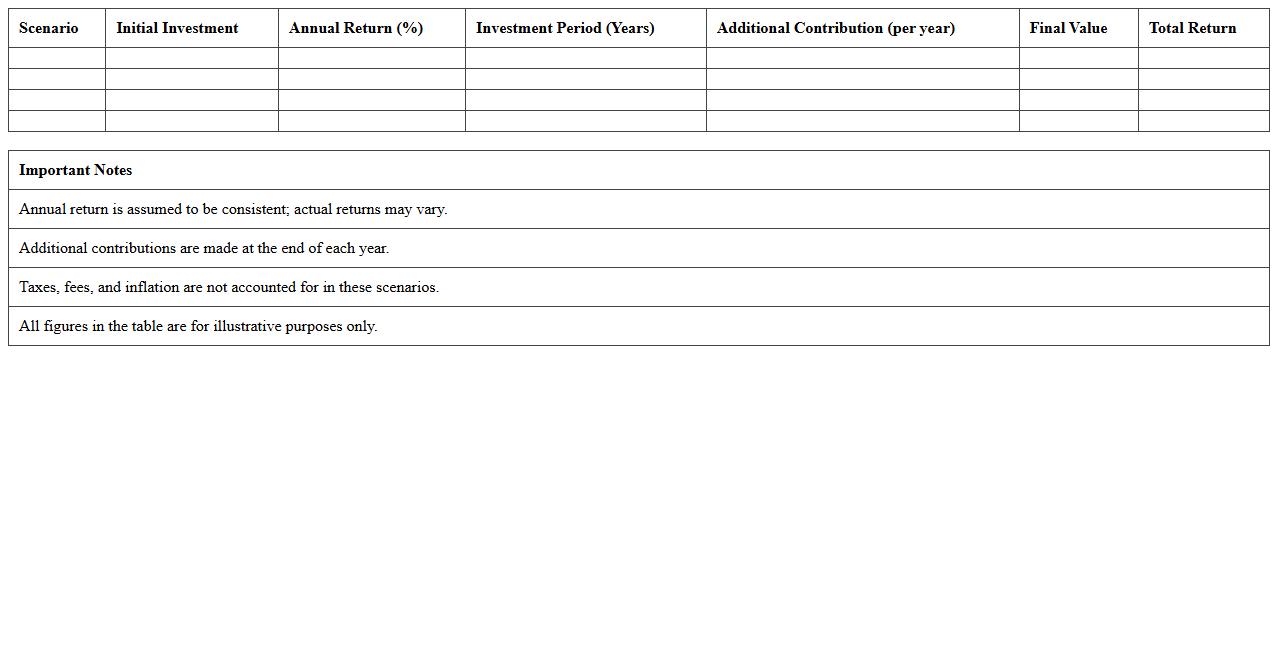
Investor Return Scenario Planner Excel
The
Investor Return Scenario Planner Excel document is a powerful financial modeling tool designed to project potential investment returns based on various market conditions and input variables. It helps investors analyze multiple scenarios by adjusting factors such as investment amount, time horizon, and expected rate of return to forecast gains or losses accurately. This planner is essential for making informed decisions, optimizing portfolios, and managing risk effectively by visualizing diverse financial outcomes.
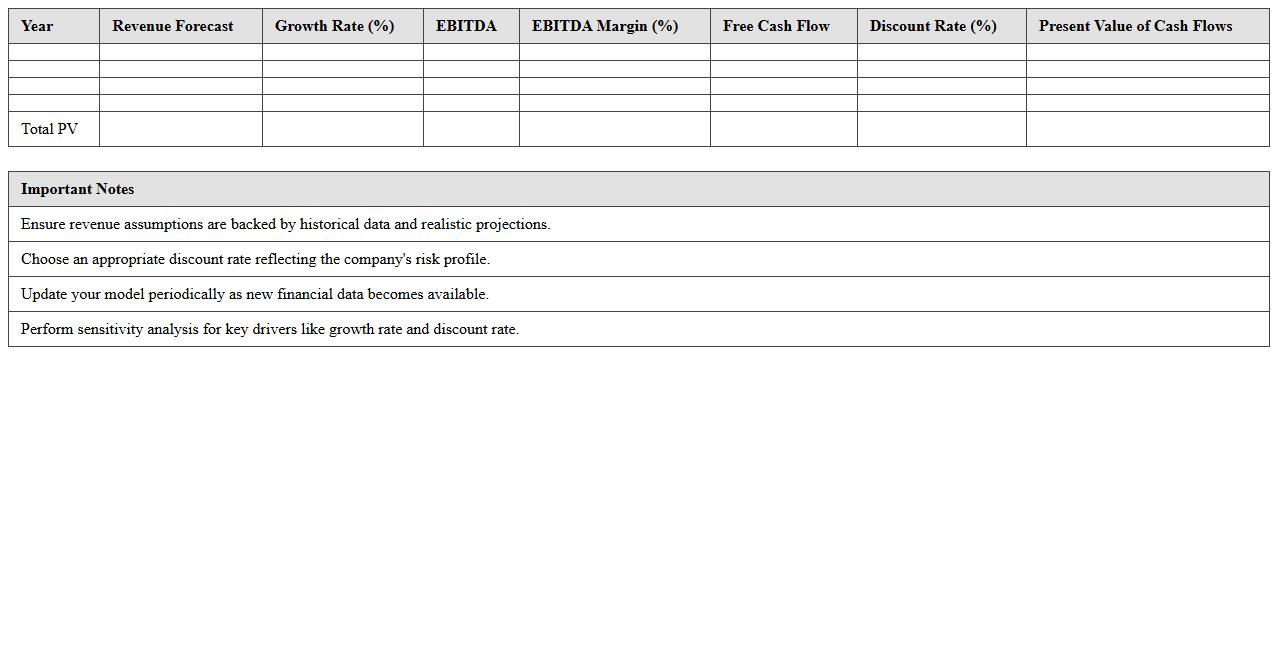
Revenue Forecast and DCF Dashboard Excel
The
Revenue Forecast and DCF Dashboard Excel document is a financial tool designed to project future revenue streams and calculate the discounted cash flow (DCF) to assess an investment's intrinsic value. It consolidates key revenue assumptions, cash flow projections, and discount rates into an interactive dashboard for clear visualization and analysis. This helps businesses make informed decisions by identifying growth opportunities, evaluating financial viability, and optimizing investment strategies.
Equity Dilution Tracker for Tech Startups Excel
The
Equity Dilution Tracker for Tech Startups Excel document is a powerful tool designed to monitor changes in ownership percentages as new funding rounds occur or shares are issued. It helps founders and investors visualize the impact of equity dilution on their stakes by providing clear, real-time calculations of share distribution. This tracker enhances decision-making by ensuring transparency and accuracy in equity management during startup growth phases.
Customized DCF Model Template for New Tech Businesses
The
Customized DCF Model Template for New Tech Businesses document provides a tailored financial forecasting tool specifically designed to evaluate the future cash flows and intrinsic value of emerging technology companies. By incorporating unique industry variables such as rapid growth rates, high R&D expenses, and market volatility, this template enhances the accuracy of discounted cash flow analyses for startup ventures. This enables investors and entrepreneurs to make informed funding, valuation, and strategic planning decisions with greater confidence.
How should user acquisition costs be modeled in DCF templates for early-stage SaaS startups?
User acquisition costs (UAC) should be treated as a direct expense tied to customer growth in the DCF model. Accurately forecasting UAC involves linking costs to expected new user volumes each period. This ensures the model reflects the impact of marketing spend on revenue generation and cash flows.
What is the best way to estimate a terminal value for tech companies with negative earnings?
For tech companies with negative earnings, the preferred method is to use a revenue multiple or a unit economics-based exit multiple. Terminal value should be based on scalable, long-term market potential, not short-term earnings. This approach avoids undervaluing the company due to current profitability challenges.
How do you integrate scenario analysis in Excel for varying churn rates in subscription-based startups?
In Excel, create separate input cells for different churn rate scenarios such as best case, base case, and worst case. Use data tables or scenario manager tools to dynamically calculate outputs across various churn assumptions. This facilitates visualization of the impact on customer retention and revenue streams.
Which tech-specific drivers should be included in a DCF sensitivity analysis dashboard?
The sensitivity dashboard should include key drivers like customer acquisition cost, churn rate, average revenue per user (ARPU), and monthly recurring revenue (MRR) growth. Additionally, variables such as R&D spend intensity and gross margin rates provide critical insights. These factors directly influence cash flow volatility and valuation.
How can projected R&D expenses be accurately factored into the DCF model for pre-revenue startups?
R&D expenses should be modeled as a significant operating cost reflecting investments in product development stages. Tie R&D spend to a timetable of milestones or phases to mirror expected progress and cash burn. This approach captures the importance of innovation while influencing free cash flow projections realistically.
More Analysis Excel Templates